


Super Bowl LIV Preview: An Analytical Guide to Sunday's Big Game

We're nearly there. We're almost to the 54th Super Bowl in NFL history. And, boy, it should be a good one.
The San Francisco 49ers and Kansas City Chiefs ranked as the second- and third-best teams in the NFL this season based on numberFire's nERD metric, which indicates expected point differential against an average opponent on a neutral field. Plus, we'll be seeing the NFL's second-best opponent-adjusted defense (the 49ers) against the NFL's third-best adjusted offense (the Chiefs). So, yeah, it's easy to get excited.
And with FanDuel's single-game contests and plenty of offerings over on Super Bowl odds, there's no shortage of action to be had on the big game.
But what do the analytics have to say about what we can expect on Sunday?
Let's dive in.
Week-by-Week Efficiency Ratings
The Chiefs and 49ers had very different paths to the Super Bowl. Here are how their weekly nERD scores looked entering each week of the season (including Week 0 (their preseason rating) and their current mark entering Week 21 -- or Super Bowl week). (You can click on the image to make it larger.)
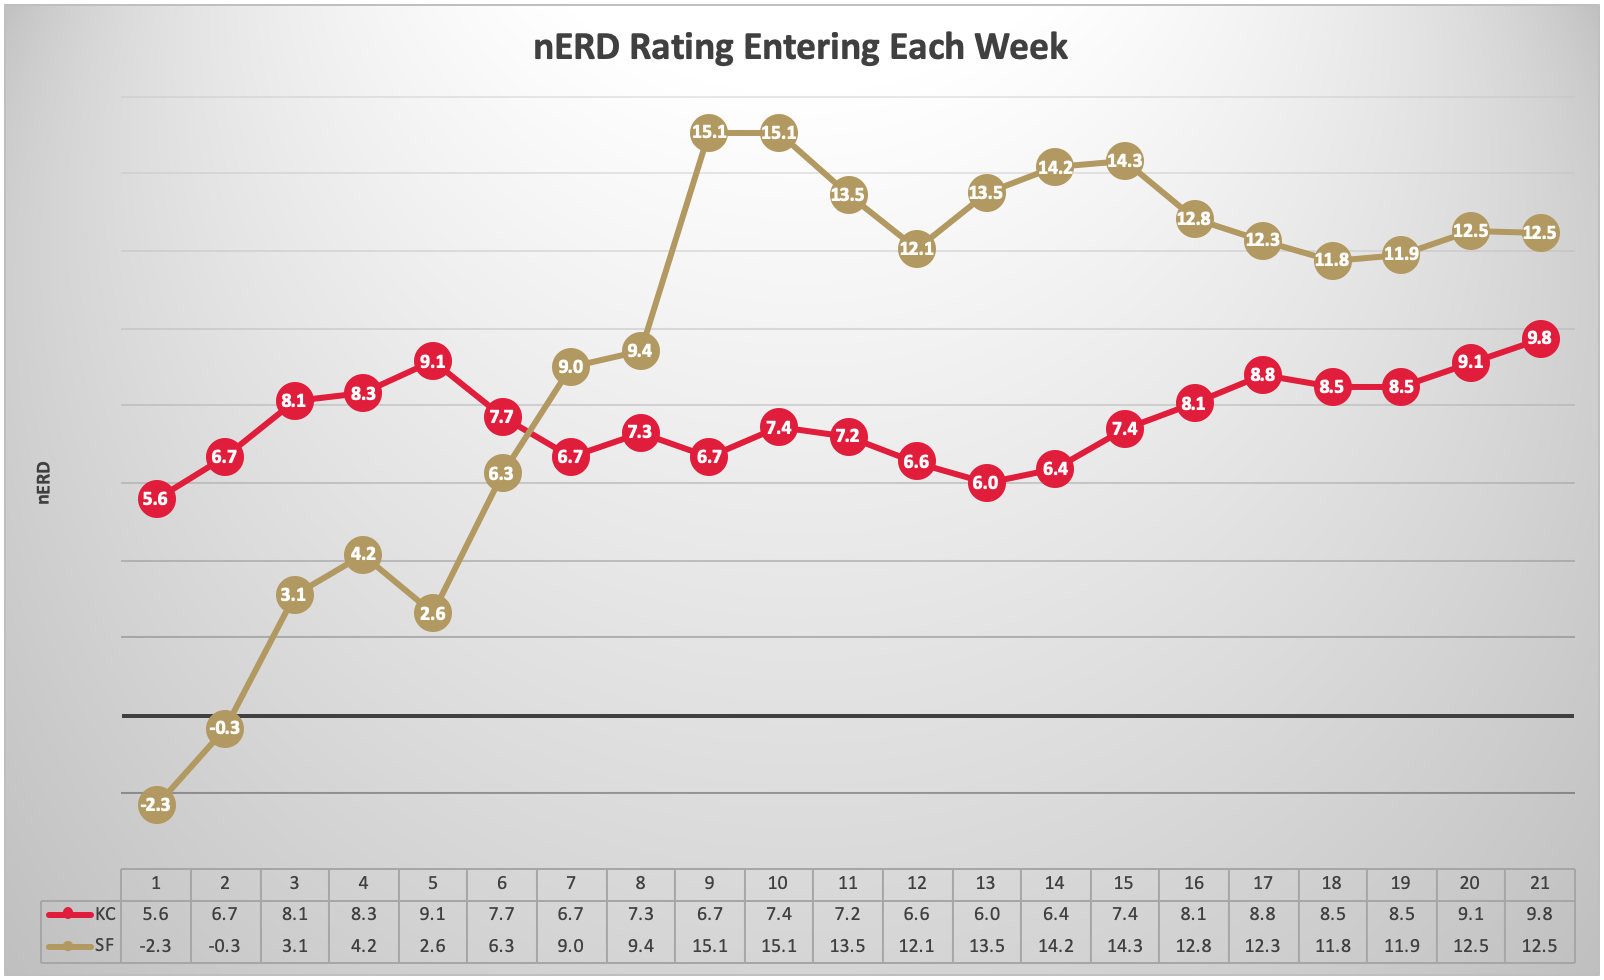
The Chiefs started the season ranked third in numberFire's algorithm-based power rankings. Their nERD score was 5.60, meaning we'd have expected them to win by nearly a touchdown against an average team on a neutral field. Once the season began, they were very consistent from start to finish, keeping their nERD score between 6.01 and 9.75 thereafter.
The 49ers were seen as a subpar squad entering the year, as numberFire's algorithm pegged them at 23rd and giving them a nERD rating of -2.31. After one win, their nERD score was -0.33, tying them with the Pittsburgh Steelers as the "best" team with a negative nERD.
They quickly outplayed that number even more and shot up to a 3.10 nERD after the second week of action and were up to 9.01 through Week 6. The 49ers peaked at a 15.08 nERD after Week 8, when they were a perfect 7-0.
Despite starting 7.91 points worse than the Chiefs by nERD, the 49ers overtook them by Week 7 and now rank nearly three points better (12.48 to 9.75).
Playoff and Super Bowl Odds
Starting the season with only a 23.9% chance to make the playoffs, the 49ers were more than 50% likely by the end of Week 2, and they hit 79.9% after Week 5. For the Chiefs, they never dipped below their preseason projection of 67.1% and were at least 84.4% likely to make the playoffs every single week after Week 1.
As for the Super Bowl odds, well, they look way more fun.

You can see the Chiefs' odds started well enough before falling a few times throughout the season.
At 8.4% to begin the year, the Chiefs were the second-most likely team to win the Super Bowl based on numberFire's projections. The New England Patriots led at 11.5%. After a Week 5 loss to the Indianapolis Colts, Kansas City's title odds fell from 21.8% to 14.7%.
When Patrick Mahomes got hurt during Week 7, they were fairly steady until a Week 10 loss to the Tennessee Titans dropped their record to 7-4. They experienced a huge shift in Super Bowl win odds entering the Wild Card Round, thanks to an unlikely bye stemming from the Patriots' Week 17 loss to the Miami Dolphins.
The 49ers' odds were mostly the opposite: climbing steadily throughout the season without many hiccups at all. Our algorithm -- understandably -- really liked them after five weeks of action. The Niners' odds climbed each week until a Week 10 overtime loss to the Seattle Seahawks, the 49ers' first loss of the season. Only once since then did their odds fall into the single-digits -- after their Week 13 loss to the Baltimore Ravens.
As of now, you can see that our algorithm likes the Chiefs to edge out the 49ers 53% of the time (52.9% to be more precise).
Which analytics support that projection -- and what in the data shows promise for a 49ers victory?
Can Mahomes Beat the Elite Defense?
The 49ers are one of the best defenses we've seen in a long time, based on numberFire's Net Expected Points (NEP) metric. NEP is an expected points model, which contextualizes performance based on down and distance and situation. So, while yardage shows a 5-yard play as more desirable for a defense than a 10-yard play, if the 5-yard gain comes on 3rd-and-2 and leads to a first down, it's a worse defensive play than allowing a 10-yard play on 3rd-and-15. NEP accounts for all these differences and displays a truer level of performance. It's also adjusted to opponent strength.
The 49ers ranked second in Adjusted Defensive Passing per play allowed this season and were eighth against the rush by that same metric. Only two other teams were top-eight in both metrics this season (the Steelers and Buccaneers to sate your curiosity), and only 65 teams since 2000 can say the same. So only about 10% of teams were that balanced and that good defensively since 2000.
Mahomes, then, will have his work cut out for him.
In two games against top-four adjusted pass defenses this season, Mahomes did sort of okay (I'm understanding things for effect). He averaged 328.5 yards and a per-drop back Passing NEP score of 0.31. The full-season average for all passers was 0.09. All quarterbacks against top-four pass defenses averaged -0.05 Passing NEP per drop back.
Think about it this way: 40 drop backs by the average quarterback against a top-four defense at the -0.05 clip would net a team -2.00 expected points. That means there are points coming off the scoreboard just by playing really tough opponents. That's what good defenses can do. Mahomes over 40 drop backs -- at that 0.31 rate -- would add 12.4 points. That's a 14.2-point swing over four quarters.
Of course, the sample is small in those games, but we do know that Mahomes outperformed expectations pretty much week after week. Comparing his performance to his opponent's expected output allowed, Mahomes added 105.17 points above expectation. There are layers to this -- I know.
So, Mahomes' Passing NEP this season was 151.29. That means he added about 150 points to the Chiefs' offense based on his performance. If he played to the average of the opponents he faced -- a pretty tough schedule -- he'd have recorded only 46.12.
If he played to the level of the defense, he'd have performed like -- gulp -- a poor-season from Tom Brady or Teddy Bridgewater but instead fared as well as Lamar Jackson during an MVP campaign.
Not every game was pristine, however, and Mahomes underperformed expectation (just barely) in 6 of 14 games. Two of Mahomes' four worst games came against the Los Angeles Chargers, including his worst performance relative to expectation on the season in Week 11's neutral-field matchup in Mexico. Was it from getting pressured? Partially, but not entirely.
According to ProFootballFocus, Mahomes was pressured at his fifth-highest rate in Week 11 but at his lowest rate in Week 17's win over the Chargers. His other below-expectation games came in Weeks 4, 5, 6, and 13. Generally, those came with high pressure rates, but pressure rate alone doesn't really correlate with his worst games. In fact, in his six worst games, he was sacked seven total times, and four of those sacks came in on game. He was sacked three times in his other worst five outings.
He just didn't throw multiple touchdowns in any of the games, and the answer to slowing down Mahomes isn't readily obvious by studying the data trends from 2019. The Chiefs could put up points, and that's why the over/under in this game is 54.5 and the Chiefs' implied team total is 28.0 points against a team that allowed just 19.4 per game this season.
What If Jimmy Garoppolo Has to Throw?
Mahomes and the Chiefs could score, and that could impact the game plan for San Francisco.
The 49ers have taken the opposite approach of the Chiefs to get to the Super Bowl. Whereas Mahomes has thrown 70 passes for 615 yards and 8 touchdowns in two postseason games, Jimmy Garoppolo has thrown 27 passes for 208 yards and a single touchdown.
The Chiefs rank as a top-five adjusted pass defense and were eighth in overall passing yards per game allowed in the regular season. It's not an easy matchup, but Garoppolo isn't exactly someone whom the 49ers are hiding behind a good defense and a run-first offense.
Garoppolo ranked 7th on the full season in Passing NEP per drop back (0.22) and was 13th in Passing Success Rate (49.8%) among 42 quarterbacks with at least 100 pass attempts. He threw at least 16 yards downfield on merely 12.6% of his passes, ranking him 41st in this sample. However, on deep passes, Garoppolo ranked third in adjusted yards per attempt (15.9). Mahomes (16.2) was first.
This isn't to say Garoppolo can go toe-to-toe with Mahomes straight up (more on that in a second), but Garoppolo's limited passing chances do not in the slightest suggest that he's unable to keep the 49ers' offense trucking along.
Additionally, Garoppolo has played above expectation against tough opponents. In seven matchups with top-12 pass defenses, he has thrown 23.1 times per game for 202.6 yards and 1.4 passing touchdowns. In terms of expected points, that's a 0.19 Passing NEP per drop back mark, above the -0.02 average for all other passers in tough matchups. In three games against top-six pass defenses, he generated 0.12 Passing NEP per drop back, thwarting the average of -0.07.
Garoppolo performed below expectation against 6 of 16 opponents (37.5%), a lower rate than Mahomes (42.9%). Garoppolo does have an off-the-rails performance against the Seattle Seahawks in there back in Week 10, when he was responsible for -17.39 Passing NEP. He was sacked five times.
But look, Garoppolo has quietly been one of the NFL's best quarterbacks this season, and in six games when he actually dropped back at least 35 times, he averaged 295.2 yards and 2.3 passing touchdowns. He had four passing touchdowns in three of those six games. Let that sink in: three games with four passing touchdowns from a quarterback who has had to throw 27 times in two games to reach the Super Bowl.
If this game does erupt into an offensive shootout, the 49ers aren't automatically thrashed.
Establishing the Ground Game
Running the ball is again a hot debate among football fans. And, look, people who favor analytics aren't exactly against running the football. We're against running the football terribly, which is very, very, very easy to do.
The average running back carry -- even if we remove costly fumbles -- during the 2019 season has increased expected scoring by 0.01 points per play. That's not a lot. We'd need 100 carries to add a point to a team's expected output. By comparison, the average drop back has led to 0.09 expected points. So, yeah.
But here's the thing: both teams in this game run the ball efficiently. The Chiefs ranked 9th in Adjusted Rushing NEP per play, and the 49ers ranked 16th. I get that the 49ers were second in rushing yards per game this season (144.1), but they weren't necessarily hyper-efficient with every carry, and they did a fair amount of damage in the second half.
The 49ers also didn't exactly establish the run from the first quarter to get their leads. They weren't super pass-heavy, but they weren't the same team we've seen in the playoffs.
Here are their quarter-by-quarter pass-rate splits and NFL ranks, according to SharpFootballStats.
This season, After the first quarter, they were one of the two most run heavy teams in each of the final three quarters, but they were nearly league-average in pass attempt rate early on. (The Chiefs took the pass-first approach until the clock-milking minutes of the fourth quarter.)
| Pass Rates (Rank) | 1st Quarter | 2nd Quarter | 3rd Quarter | 4th Quarter |
|---|---|---|---|---|
| San Francisco | 54% (22) | 55% (31) | 44% (31) | 39% (32) |
| Kansas City | 68% (1) | 71% (2) | 60% (10) | 45% (29) |
| NFL Average | 56% | 63% | 56% | 59% |
San Francisco passed the ball on 54% of their first-quarter plays That was just shy of the NFL average of 56%. They averaged 8.0 yards per pass attempt (compared to the NFL average of 7.4). They were a good passing team early and then didn't have to throw often. The 49ers led on 62.5% of their plays, the fifth-highest rate in the league.
It was worth it to dig into their pass-rate splits when playing a game within seven points either way, an estimate of what they may do in a close game. Do things change when looking at a one-score game? A little -- but not much.
| One-Score Pass Rates (Rank) | 1st Quarter | 2nd Quarter | 3rd Quarter | 4th Quarter |
|---|---|---|---|---|
| San Francisco | 55% (21) | 53% (30) | 48% (29) | 52% (26) |
| Kansas City | 68% (1) | 70% (2) | 59% (9) | 55% (20) |
| NFL Average | 56% | 61% | 54% | 59% |
The recipe for the 49ers has been to use the efficient passing game to get a lead and then just pack it in a bit. Against Mahomes and the explosive Chiefs' offense, we can assume that the 49ers will want to keep the ball on the ground until they can't.
This season, the Chiefs allowed 0.13 Rushing NEP per carry (when removing fumbles) to running backs, the second-highest mark in the NFL. That means a carry against the Chiefs was more impactful than an average drop back (0.09) against all opponents. That's pretty bonkers -- and lends itself to the idea that the 49ers can run it efficiently.
Even when we reduce the sample to after their bye, Kansas City let up 0.05 Rushing NEP per carry to backs, 22nd in the NFL. In terms of Rushing Success Rate (the percentage of carries yielding an increase in expected scoring), the Chiefs were better (44.3%; 12th) since the bye. But explosive carries are still there to be had for the 49ers.
And in the very rare event that they were down at least seven points this season, they threw 59% of the time. That still ranked 31st in the split, but we could see close to a 55% to 60% pass rate from the 49ers if they don't ever get out ahead on the Chiefs. This is one of the most intriguing storylines in the data. San Francisco can throw it -- when they need to -- but they may be able to run it well enough on Kansas City to play their game.
The Downfield Threats and a Possible Secret Weapon
Quarterbacks don't need to sling it deep often in order to make an impact, but if either team falls behind, one team has a clear advantage in slinging it deep. Spoiler: it's not the 49ers.
This season, according to FantasyADHD.com, Garoppolo ranked 33rd among 34 passers with at least eight games played in average target depth. His average downfield depth was only 6.5 yards. In fact, he accrued more than 300 air yards in just one game this season, tied for the lowest rate (6.3%) of these 34 quarterbacks (Derek Carr also did it just once in 16 games). Mahomes, on the other hand, ranked 10th in average target depth, and he tallied at least 300 air yards in 7 of 14 games.
The difference in air yards per game was 305.8 for Mahomes and 193.9 for Garoppolo. In a single game, one or two big plays can make the difference. Of course, we already mentioned that both passers were top-three in adjusted yards per attempt on passes at least 16 yards downfield this season, and this again plays into the idea that Garoppolo can produce when asked.
And with two elite deep-ball passers, it's not a shock that we have some of the most efficient downfield threats in the league geared up for the big game.
| Downfield Efficiency | POS | Team | Rec | Tgt | Yards | TD | Reception NEP/Tgt |
Rank |
|---|---|---|---|---|---|---|---|---|
| Mecole Hardman | WR | KC | 7 | 13 | 266 | 3 | 1.94 | 3 |
| George Kittle | TE | SF | 9 | 12 | 253 | 2 | 1.94 | 4 |
| Deebo Samuel | WR | SF | 8 | 12 | 197 | 1 | 1.61 | 11 |
| Tyreek Hill | WR | KC | 21 | 35 | 551 | 4 | 1.57 | 12 |
| Demarcus Robinson | WR | KC | 7 | 13 | 219 | 4 | 1.55 | 14 |
| Sammy Watkins | WR | KC | 12 | 23 | 381 | 2 | 1.43 | 22 |
| Travis Kelce | TE | KC | 21 | 33 | 520 | 3 | 1.37 | 26 |
Among 108 players with at least 10 downfield targets, Mecole Hardman ranked third in Reception NEP per target (1.94). In the AFC Championship game, Hardman played 39.7% of the Chiefs' offensive snaps, a big deviation from his small-time role prior. He had just one target but has 4.33-second 40-yard dash speed, and Jim Sannes points out that speed can kill the 49ers. Andy Reid could have a play or two drawn up for Hardman to try to lift the lid while the Niners' secondary has its hands full with everyone else.
George Kittle (1.94) ranked fourth in deep target efficiency. Kittle actually had only 12 downfield targets in the regular season, which did rank him 13th among tight ends, but he had 19 last year and has been a victim of the new, run-heavy game plan. By comparison, Travis Kelce led all tight ends with 33. The efficiency wasn't as good as Kittle's, but he had nearly three times the opportunities.
While it's tough to compare any NFL player to Tyreek Hill in terms of being a downfield maven, Deebo Samuel showed some promise over a small sample.
Again, it's a situation where we see that the 49ers have capabilities when forced to throw and even throw downfield. It just hasn't been their game, so it'll be vastly intriguing to see what happens if Garoppolo and the 49ers unleash it. Both teams can make splash plays with various playmakers.
Special Teams
Sometimes special teams can make the difference in a single game, but this matchup presents us with two very similar overall units.
| Special Teams NEP (Rank) | Offensive | Defensive | Total |
|---|---|---|---|
| San Francisco | 35.21 (15) | 40.85 (22) | -5.64 (19) |
| Kansas City | 32.93 (18) | 38.77 (18) | -5.84 (20) |
It doesn't get much closer than that, and neither team boasted particularly great special teams units, but one potential differentiator exists: kickers.
Field goal percentage doesn't always tell the full story, but Harrison Butker (89.5%) ranked 6th this year among 33 qualified kickers, and Robbie Gould (74.2%) ranked 26th. That translated into the expected points world. Among 29 kickers with at least 20 field goal attempts in 2019, Gould ranked 24th in Field Goal NEP per attempt (0.04). Butker (0.47) ranked eighth.
Gould was 0 for 4 on field goal attempts from 50-plus yards; Butker was 3 for 6. Butker was also a perfect 13 for 13 from 40 to 49 yards, while Gould was 6 of 8 from that distance.
Gould did, though, convert on 11 of 12 field goals and all 7 extra points in the fourth quarter when the game was within 7 points. Butker was five of six on field goals and eight of nine on such extra points.
Analytically Comparable Teams
At numberFire, we can dig back into our database and see which historical teams are most similar to current teams. Here are each team's top-five comparable squads and their fates. It's about as close as you could possibly ask for.
| Chiefs Comps | Result | 49ers Comps | Result |
|---|---|---|---|
| 2013 Saints | Lost Divisional Round | 2012 Texans | Lost Divisional Round |
| 2009 Saints | Won Super Bowl | 2013 Seahawks | Won Super Bowl |
| 2012 Packers | Lost Divisional Round | 2011 Texans | Lost Divisional Round |
| 2017 Saints | Lost Divisional Round | 2015 Panthers | Lost Super Bowl |
| 2009 Colts | Lost Super Bowl | 2017 Jaguars | Lost Conference Championship |
Each team has a Super Bowl winner and loser in their recent profiles, and the only difference is that the Chiefs' other three comps all lost in the divisional round. The 49ers' had a Conference Championship loser in the mix.
We also can leverage this type of analysis and find similar games historically. The most comparable game to this matchup since 2000 came back on December 8th, 2013 between the New Orleans Saints and the Carolina Panthers. The Saints represent the Chiefs in this one, and they won it 31-13. We already know the 2013 Saints had a lot in common with the Chiefs (second-best adjusted offense, top-seven adjusted pass defense). The 2013 Panthers were the 3rd-best adjusted defense and a balanced offense that was 10th overall.
In this game, the Panthers ran for 128 yards and a 52.2% Rushing Success Rate -- something the 49ers could be attempting to do -- but it wasn't enough to fend off the elite passing attack on the other side of the ball.
Drew Brees picked apart the NFL's fourth-ranked adjusted pass defense en route to 313 yards and 4 touchdowns on 44 drop backs, good for 19.09 Passing NEP. Marques Colston went off for 125 yards and 2 touchdowns on 13 targets, and Jimmy Graham caught 6 of 11 targets for 58 yards and 2 touchdowns of his own.
Conversely, Cam Newton was 22 of 34 for 160 yards and a touchdown (-6.56 Passing NEP). Greg Olsen was limited to 40 yards on 12 targets, and Steve Smith was also held in check (6 catches for 49 yards and a touchdown on 8 targets).
Premium subscribers can see the 25 most comparable historical games to Super Bowl LIV to help find betting and fantasy trends.
Expected Outcome
The Chiefs are favored in this game by 1.5 points, and more than 70% of the bets have come on the Chiefs to cover the spread, according to oddsFire. The betting action really points to the over, implying a high-scoring matchup. numberFire's algorithm gives the Chiefs a 52.9% chance to win Super Bowl LIV.
I won't lie, though. When I first saw the line, I was a tad surprised that the 49ers weren't favored, given the elite defense and underrated offense. Maybe that says a lot about me. They do everything you can ask for from a team.
But after a lot of contemplating, if I had to pick a side, I'm leaning toward the Chiefs, 31-24.


