


Which Running Backs Will Score More Touchdowns in 2018?


Back in high school, I authored a satirical website about my school's football team. It didn't end well once a freedom hater concerned student alerted the administration.
One of the running jokes was that a friend of mine, who was not on the football team, was holding out for more money. I joked that he once scored 5 touchdowns on 3 touches to go along with 400-plus yards, an impossible feat. You can't net 400 yards on 3 touches. You can't score more touchdowns than times you touch the ball.
But the more times you touch the ball, the more times you should score. That's just how the world works. And the math backs it up. So we can use that to figure out which running backs should've scored more often in a season than they actually did.
The Process
Running the ball isn't efficient. That's just a fact. It's not an efficient way to move the sticks and increase a team's chances of scoring.
According to our Net Expected Points (NEP) metric -- the points a player adds to his team's expected output -- the average running back carry in the NFL actually loses a team expected points (a loss of around 0.02 points per carry in 2017). When you rack up 350 carries of "average" production, you're actually going to lose your team around a touchdown's worth of production.
So rather than rely on expected points, we'll turn to straight up volume to identify touchdown regression candidates for 2018. The relationship between rushing yards and rushing touchdowns is decent on its own, but total touchdowns and total yards actually has a higher R-Squared value.
Here's how total yards and total touchdowns since 2009 (among players with at least 100 touches) looks when graphed.
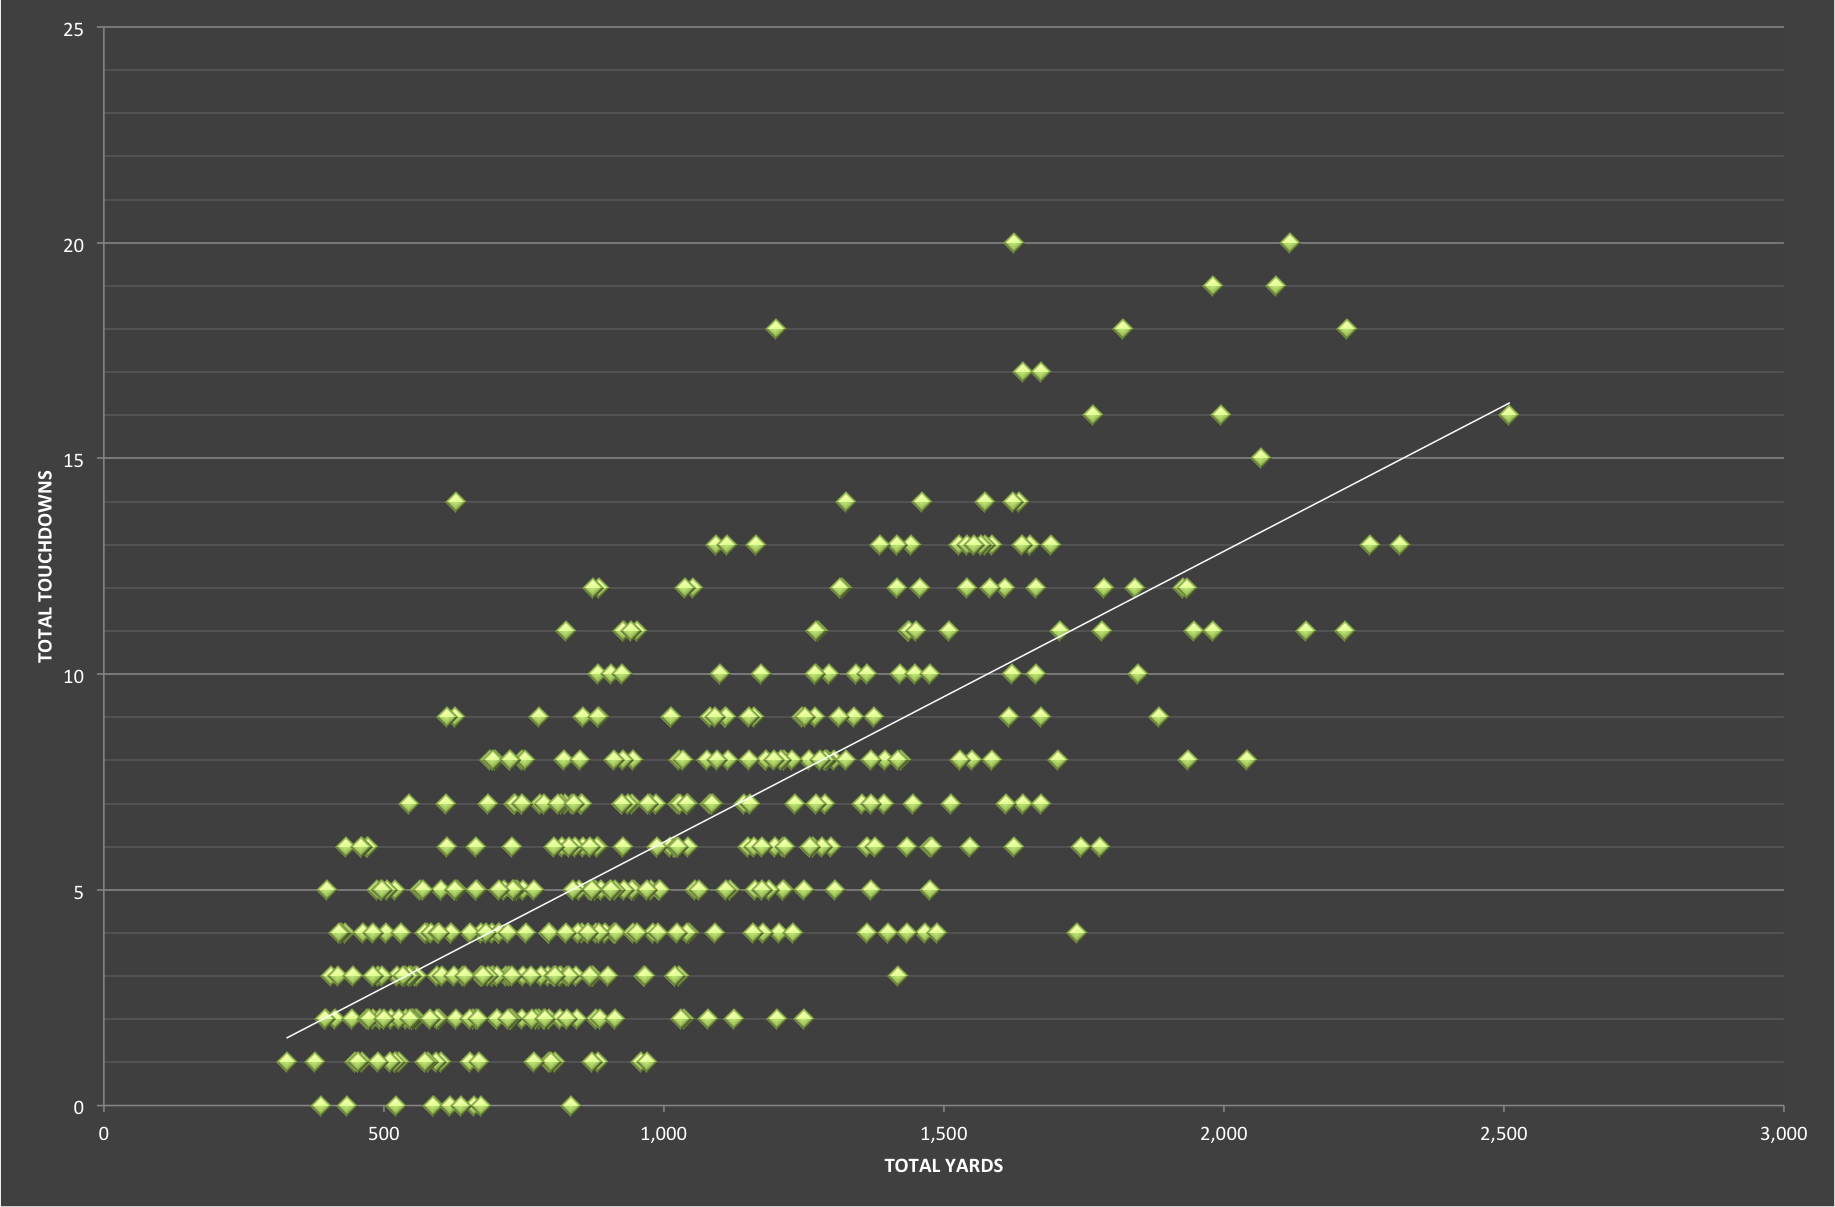
From this, we can glean that a player who totals 1,500 yards should wind up around 9.5 touchdowns in a season and that a 1,000-yard producer should score about 6.0 times.
Players who outperform or underperform expectations will be flagged as regression candidates for the 2018 season. Of course, this doesn't account for players who are red-zone threats who score at a high rate without racking up yardage.
Backtesting: 2017 Regression Candidates
We will fit 2016's performance to our trendline in order to backtest this for the 2017 season.
We have just 12 rushers who should've had at least 1.0 more touchdowns in 2016 than they actually did, but the model pegged some winners.
| Player | Total Yards | 2016 TD | Touch/TD | 2017 TD | Touch/TD |
|---|---|---|---|---|---|
| Duke Johnson | 872 | 1 | 126.0 | 7 | 22.3 |
| Jordan Howard | 1,611 | 7 | 40.1 | 9 | 33.2 |
| Le'Veon Bell | 1,884 | 9 | 37.3 | 11 | 36.9 |
| TJ Yeldon | 777 | 2 | 90.0 | 2 | 39.5 |
| Eddie Lacy | 388 | 0 | 0.0 | 0 | |
| Dion Lewis | 377 | 0 | 0.0 | 9 | 23.6 |
| Lamar Miller | 1,261 | 6 | 49.8 | 6 | 45.7 |
| Bilal Powell | 1,110 | 5 | 37.8 | 5 | 40.2 |
| Jacquizz Rodgers | 658 | 2 | 71.0 | 1 | 73.0 |
| Ty Montgomery | 805 | 3 | 40.3 | 4 | 23.5 |
| Todd Gurley | 1,212 | 6 | 53.5 | 19 | 18.1 |
| Alfred Blue | 460 | 1 | 112.0 | 1 | 78.0 |
| Deandre Washington | 582 | 2 | 52.0 | 3 | 30.3 |
So we don't have a touch per touchdown rate for Dion Lewis here, as he didn't score at all in 2016, but he scored nine touchdowns in 2017. Eddie Lacy failed to score in either season.
Other than Bilal Powell and Jacquizz Rodgers, whose touch per touchdown rates worsened by less than 2.5 each (so essentially stayed the same), the other nine rushers here improved their touchdown rates.
A big mover was Duke Johnson, who should've scored 5.2 times in 2016 but actually scored just once. He wound up with 7 touchdowns in 2017, scoring once every 22.3 touches compared to once on 126 touches in 2016.
Also a big mover -- who did undergo a big offensive change and who actually is our poster boy for negative regression in 2018 -- was Todd Gurley. Gurley scored 6 times on 1,212 yards but should've had 7.5 touchdowns in 2016. He scored once every 53.5 touches in 2016 but once every 18.1 times in 2017.
So, not every player on here improved, but nobody drastically worsened in touchdown rate. And not every player posted a massive touchdown total. In fact,
three of them still scored just once (or not at all). But of the seven to see at least 100 touches, each scored at least five times.
That's promising.
2018 Regression Candidates
The model plucked out 16 rushers who should've had at least 1.5 more touchdowns in 2017 than they actually did (among backs with at least 50 touches).
| Player | Total Yards | TD | Expected TD | Difference |
|---|---|---|---|---|
| Isaiah Crowell | 1,035 | 2 | 6.3 | -4.3 |
| Jay Ajayi | 1,031 | 2 | 6.3 | -4.3 |
| CJ Anderson | 1,231 | 4 | 7.6 | -3.6 |
| Frank Gore | 1,206 | 4 | 7.4 | -3.4 |
| Wayne Gallman | 669 | 1 | 3.8 | -2.8 |
| Samaje Perine | 785 | 2 | 4.6 | -2.6 |
| Alfred Morris | 592 | 1 | 3.3 | -2.3 |
| Devontae Booker | 574 | 1 | 3.2 | -2.2 |
| Shane Vereen | 417 | 0 | 2.2 | -2.2 |
| LeSean McCoy | 1,586 | 8 | 10.0 | -2.0 |
| Mike Davis | 371 | 0 | 1.9 | -1.9 |
| Kerwynn Williams | 519 | 1 | 2.8 | -1.8 |
| LeGarrette Blount | 816 | 3 | 4.8 | -1.8 |
| Lamar Miller | 1,215 | 6 | 7.5 | -1.5 |
| Joe Mixon | 913 | 4 | 5.5 | -1.5 |
The four primary green flag candidates all have unique team situations.
Isaiah Crowell is changing teams, from the Cleveland Browns to the New York Jets. If he does cling to the goal-line role, his volume, role, and touchdown regression could lead to an overachieving fantasy season.
Jay Ajayi garnered some yardage with the Miami Dolphins last season but now enters with the chance to be the lead back in Philadelphia's committee.
Both C.J. Anderson and Frank Gore changed teams in the offseason. Anderson has a realistic chance to cash in on his touchdown regression, as Jonathan Stewart's departure leaves behind 57% of the Carolina Panthers' carries from inside the five-yard line. Gore will contend with Kenyan Drake and Kalen Ballage in Miami.
Wayne Gallman and Samaje Perine suffer from the addition of rookie rushers, Saquon Barkley and Derrius Guice, respectively.
Near the bottom of the list, we see LeSean McCoy, whose offense could be the worst in football in 2018, as the Buffalo Bills turn over to a combination of A.J. McCarron and Josh Allen.
Lamar Miller could take advantage of a high-octane offense, provided that Deshaun Watson returns to form in his sophomore season. Joe Mixon's offensive line in Cincinnati has improved, and that could help him soak up extra touchdowns in 2018.


