


Analyzing Trends in FanDuel's 2020 Perfect Daily Fantasy Football Lineups


"The floor is lava" was an integral part of my childhood. You got to mess up the couch cushions, jump around in the house, and scream for absolutely no reason at all. It checks all three boxes on a kid's wishlist.
The stakes were high. If you touched the floor, you disintegrated into ash, and all those beanie babies you were saving to pay college tuition would go to some other lucky bozo. Nothing was more horrible than that thought.
We need to take that same aversion to the floor and apply it to daily fantasy football.
For so long, whenever we've analyzed a player, we've talked about their "floor," or the lower end of their range of outcomes. The idea was that a high-floor player would increase the expected point total of your lineup. In theory, prioritizing that makes sense. There's nothing wrong with your floor being higher.
But if it comes at the expense of a ceiling, we're going to lose money.
In 2020, the average NFL game featured 49.6 total points scored. It was 45.4 the five years prior to that. We could see scoring regress once fans are back in stadiums again, but with other factors such as quarterback quality, penalty enforcement, and decision-making all trending toward higher-scoring environments, it's unlikely we go all the way back to pre-2020 levels.
As real-game scoring increases, so do DFS totals. With that, if you want to take down a tournament, focusing on a player's floor is a waste of time. It's all about the ceiling, baby.
The question becomes how we identify those ceilings. What data can tell us a big output is imminent? How else can we tweak our rosters in the pursuit of a points palooza?
One method is focusing on perfect lineups. These tell us what has worked in the past, and -- importantly -- they show us how we can find ceiling at each position while dealing with the restraints of a salary-cap system.
That's what we're going to do today. We're going to go back through the best lineup you could have built each week of the regular season on FanDuel and see what commonalities there were in these high-ceiling performances. Then, we'll take that info and see how we can apply it to 2021 and beyond.
You can't have a discussion around upside without focusing on stacks and game stacks, both of which are key pieces to a high-upside roster. So let's start there and then go position-by-position.
Single-Team Stacks
For those who may be new to DFS, "stacking" is when you pair one player with another player on their team in the same lineup. Often, one of the players will be a quarterback in hopes you can double dip and get points both for a passing touchdown and a receiving touchdown at the same time.
Not shockingly, stacking a quarterback with a pass-catcher was common in perfect lineups. But other pairings popped up often, as well.
A perfect lineup isn't the best way to illustrate the value of stacking because it requires both players to be among the highest scorers at their position for the week. That's a tough ask for multiple teammates, and there's value in a stack even if only one of the players hits their absolute ceiling.
Even with that, there were 19 instances across 17 perfect lineups where teammates were paired together. Nine of them involved a quarterback, meaning there were 10 stacks with non-quarterback teammates.
Additionally, three of the quarterback stacks included more than just one additional player. There was one four-player stack and two three-player stacks. This brings our total to 42 players in perfect lineups who had a teammate alongside them, amounting to 27.5% of all perfect-lineup slots. So, an average of 2.5 players per perfect lineup were part of a single-team stack, and this isn't even the best format to show the value of it. Clearly, you're going to want to stack often.
The big question is which positions you should stack together outside of a quarterback with a pass-catcher. Based on the data, the answer is stacking a running back with literally anybody.
In total, after we match up all the combinations from the three- and four-player stacks, there were 28 positional pairings in perfect lineups this year. Here's how often each combo popped up.
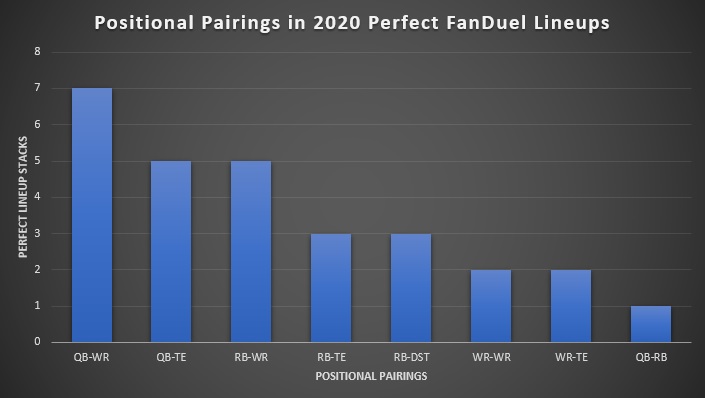
Twelve of the 28 combinations involved a running back. They were paired with a pass-catcher eight times, their team's defense three times, and a quarterback once. Running backs were involved in just one less stack pairing than quarterbacks.
It's pretty easy to explain why this would happen. Running backs are competing with receivers for volume, but the overlap between the two isn't as great as it is with two wide receivers. In other words, a running back going off isn't as detrimental for a team's wide receiver as one of his fellow receivers going off. Thus, it's more likely that a running back and a pass-catcher will erupt in the same game than two pass-catchers competing for the same targets.
In the past, when we've discussed stacking, it has centered largely around quarterbacks. If we discussed it with running backs, it was usually pairing them with the defense, as there is a correlation between the output of the two. But 2020 showed that we should have running backs as a more central focus of our single-team stacks, and that translates to the pass-catchers even more often than it does the defense.
The other big thing to know about stacking is that -- shocker! -- most stacks came from games with high totals. The average pre-game bookmaker total for an NFL game in 2020 was 48.1 points. The average pre-game total for stacks that landed in the perfect lineup was 51.7. And remember, this is all pre-game data, so how the game played out had nothing to do with it. This was all information available to us before kickoff.
Throughout the piece today, we'll be looking at how often players from perfect lineups were on teams with various totals and comparing that to totals for all games across 2020. This can show us which total ranges were disproportionately likely to produce a player in a perfect lineup. If we do this for stacking, it becomes obvious that the low-total games were borderline crossoffs.
| Total | Stacks | Overall |
|---|---|---|
| 53.5 or Higher | 31.6% | 12.9% |
| 48.5 to 53 | 57.9% | 34.8% |
| 43.5 to 48 | 10.5% | 40.6% |
| 43 or Lower | 0.0% | 11.7% |
Although 52.3% of all games had a total of 48 or lower, they produced just 10.5% of players who were stacked in perfect lineups. We know that high totals are great for DFS. But the bigger takeaway may be how skeptical we need to be of potential stacks in games with a low total.
We also need to be wary of teams that are big underdogs. There may be some allure in pairing a quarterback with a wide receiver when they're projected to lose because it means they'll be throwing all game. The data pushes back on that narrative in a big way. Once again, the "overall" column shows what percentage of all NFL teams entered a game with a spread in that specified range.
| Spread | Stacks | Overall |
|---|---|---|
| Favored by 10 or More | 10.5% | 6.1% |
| Favored by 5 to 9.5 | 26.3% | 19.0% |
| Favored by Less Than 5 | 36.8% | 25.0% |
| Underdogs by Less Than 5 | 23.5% | 25.0% |
| Underdogs by 5 or More | 5.9% | 25.0% |
We'll touch more on the heavily favored portion of that table in the section on quarterbacks. But as with the low-total games, if you're going to stack a team that's projected to be in catch-up mode, you had better assume they'll exceed the bookmakers' expectations.
Our key takeaways for stacking is that high-totaled games and running backs are great, and low-totaled games and underdogs are rough. That's easy to digest. But it also glosses a bit over the pass-catchers, and we need at least four of those puppies in each lineup.
Game-stacking is where they get their time to shine.
Game Stacks
Game-stacking is when you pair a player from one team with a player on the opposing team. You can think about this similar to single-team stacks where you try to pinpoint who would benefit if one player were to erupt.
But honestly, it's not the correlations that matter. You just want to stack high-total games no matter what the positions may be.
Overall, there were 25 instances where a player from both teams in a single game wound up in a perfect lineup this year. That's an average of 1.5 game stacks per lineup, and again, this isn't the optimal format for showing the value of game-stacking. This tells us we shouldn't settle for just a single game stack in each lineup. Multiple is encouraged.
Once you add in the multi-player stacks on each side, a grand total of 58 players were part of a game stack this year. That's 37.9% of all players in perfect lineups. If we take out defenses and special teams, we get to 57 of 136, or 41.9%. The defense-excluded mark was an increase of five percentage points from last year.
| Perfect Lineups | Percentage of Non-DSTs as Part of Game Stack |
|---|---|
| 2020 | 41.9% |
| 2019 | 36.0% |
| 2018 | 34.6% |
With game totals on the rise, the value of game-stacking has gone up. If you're not actively looking to stack individual games, you're falling behind.
As mentioned, it doesn't necessarily mean you have to stack them based on which positions correlate well with each other. You just want access to the high-scoring games any way you can get it. Often, that'll include a wide receiver on at least one of the sides.

Of the 34 total positional pairings, 29.4% involved two wide receivers, and 82.4% involved at least one. This is in part because you roster more of them than you do at any other position, but that's a monster ratio.
Game-stacking needs to be a central focus of our wide receiver selection process. After we pick our quarterback, we should ask if there's a receiver on the opposing side we should run it back with. The same is true with the running backs we select. Of the 59 wide receivers in perfect lineups this year, 32 (54.2%) were part of a game stack. This should be more than just a tie-breaker in our process.
As with single-team stacks, game stacks were more likely to come from high-scoring games.
| Total | Game Stacks | Overall |
|---|---|---|
| 53.5 or Higher | 24.0% | 12.9% |
| 48.5 to 53 | 40.0% | 34.8% |
| 43.5 to 48 | 28.0% | 40.6% |
| 43 or Lower | 8.0% | 11.7% |
That part's obvious, and we don't need to dwell on it. The key difference between the single-game stacks and the game stacks is the spread.
For the full season, half of all NFL games featured a spread of fewer than five points. That grouping produced 64.0% of all game stacks in perfect lineups.
| Spread | Game Stacks | Overall |
|---|---|---|
| Pick to 4.5 | 64.0% | 50.0% |
| 5 to 9.5 | 32.0% | 37.9% |
| 10-Plus | 4.0% | 12.1% |
The games with a massive spread rarely produced production from both sides. This makes sense given that a large spread implies that one side is expected to struggle. But it's worth noting just how valuable the projected tight games are.
We can combine these two points into one. Overall, 27.0% of all NFL games had both a total of at least 48.5 points and a spread of fewer than five points. That sample produced 48.0% of the game stacks in perfect lineups. Using bookmaker info as your guiding light, you should be seeking out high-scoring, tight games, stacking them aggressively (especially with wide receivers), and doing so multiple times in each lineup.
The Flex Position
The past few years, the flex on FanDuel has skewed toward running backs. We saw a slight shift toward receivers in perfect lineups this year.
| Position | Times at Flex in Perfect Lineup |
|---|---|
| Running Back | 8 |
| Wide Receiver | 8 |
| Tight End | 1 |
In 2018 and 2019, the flex spot was a running back 61.8% of the time. That fell to 47.1% this year. This is one trend we'll want to be skeptical of.
The reasoning is something we'll discuss in the section on running backs, as well: we lost a lot of studs during the season. All of Saquon Barkley, Christian McCaffrey, Nick Chubb, Joe Mixon, and Austin Ekeler missed significant time to injury, and Ezekiel Elliott lost his quarterback on top of a role reduction. There were just fewer stud running backs to jam in on a weekly basis, and it translated to the flex position.
It's something we should keep in mind if a similar barrage happens in the future. We're not locked into a running back in the flex at all times if the pickings are slim. But if things stabilize, we shouldn't be surprised if the 2020 data winds up being a one-year blip.
Quarterbacks
For each position, we'll start things off with an overview of what the average perfect player looked like. This will include bookmaker info, their output when they made the perfect lineup, and more. It'll also include that player's roster rate, or on what percentage of lineups they were in for that week's FanDuel Sunday Million. Here's that breakdown for the quarterbacks.
| Perfect QBs | Average |
|---|---|
| Salary | $8,094 |
| FanDuel Points | 34.23 |
| Roster Rate | 9.6% |
| Spread | -3.6 |
| Total | 51.5 |
| Wind | 5.1 |
| Home | 58.8% |
This is just a 17-player sample, so we'll want to be careful with some of the analysis. Specifically, seeing 10 of 17 quarterbacks at home a year after only 7 of 17 were at home is a data point we can gloss over. But there are still some actionable takeaways.
The first goes back to something we discussed in the stacking section: the spread. Quarterbacks in the perfect lineup were on teams that were favored by an average of 3.6 points. That's the highest spread for any position except tight end (-3.7). This could lead us to being more laid back in our tight-game hunting.
There is one big caveat, though, and it ties into an aspect we'll be diving into fully later in the offseason. Although perfect quarterbacks were more likely to be heavily favored than your average quarterback, the public also seemed to over-invest in quarterbacks with the spread heavily in their favor.
Here's the data to back up that claim. If you look at the three most popular quarterbacks each week throughout the season (based on FanDuel Sunday Million roster rates), the average popular quarterback was favored by 5.6 points. That's a full two points wider than what we saw from the perfect quarterbacks. Here are the popular quarterbacks versus the perfect ones based on the range for the spread.
| Spread | Popular QBs | Perfect QBs | Overall |
|---|---|---|---|
| Favored by 10 or More | 19.6% | 11.8% | 6.1% |
| Favored by 5 to 9.5 | 33.3% | 29.4% | 19.0% |
| Favored by Less Than 5 | 39.2% | 23.5% | 25.0% |
| Underdogs by Less Than 5 | 5.9% | 29.4% | 25.0% |
| Underdogs by 5 or More | 2.0% | 5.9% | 25.0% |
Although it's true that quarterbacks on teams that were heavily favored were more likely to be in the perfect lineup, it's also true that they were a lock to be among the most popular options at their position. That was not true for quarterbacks whose teams were slight underdogs.
Of the 17 quarterbacks, 5 were on teams that were slight underdogs. But of the 51 most popular quarterbacks for the season, only three were slight underdogs. Two of those three wound up making it in the perfect lineup, and the other scored 38.1 FanDuel points.
A big part of the reason we should look at both perfect lineups and where the public invested is to find inefficiencies in the market. It's clear our biggest inefficiency at quarterback is that we tend to under-roster quarterbacks who are slight underdogs.
Two other takeaways from the perfect quarterbacks stand out. One is that we need to sell out for a high total here just as much as we do with single-team stacks, which seems obvious given how often quarterbacks are in those stacks.
Of our 17 perfect quarterbacks, only 2 came from a game with a total of 48 or lower.
| Total | Perfect QBs | Overall |
|---|---|---|
| 53.5 or Higher | 35.3% | 12.9% |
| 48.5 to 53 | 52.9% | 34.8% |
| 43.5 to 48 | 5.9% | 40.6% |
| 43 or Lower | 5.9% | 11.7% |
One of the exceptions was Justin Herbert in Week 7, and that total was at 48 on the number. If you're considering a quarterback in a game with a low total, make sure you have reason to think it'll hit the over.
The other takeaway is just how many points you need to crack a perfect lineup. The average was 34.23 FanDuel points, which is quite a bit. Only Andy Dalton in Week 16 scored fewer than 30.7. Your quarterback needs a path to hit 30 points, whether it be via rushing or massive passing production. Otherwise, you're losing ground to the field.
This makes our checklist at quarterback pretty easy. In general, we need someone who can get 30 points, a number that's hard to come by in a game with a low total. That upside may get a boost if the quarterback is on a team that is a slight underdog, and quarterbacks in that scenario are unlikely to be all that popular. Finding high-upside options who aren't on a bunch of rosters tends to be difficult at most positions, but using a formula in this mold can help us get there at least at this one position.
Running Backs
Anecdotally, you would think that running backs would be more likely to be heavy favorites than quarterbacks. If a team gets a lead, they can run the ball to grind clock.
But as you'll remember when discussing quarterbacks, only tight ends in perfect lineups were more heavily favored. Running backs were actually in the second-tightest scripts as 2.4-point favorites on average.
| Perfect RBs | Average |
|---|---|
| Salary | $7,086 |
| FanDuel Points | 28.9 |
| Roster Rate | 13.7% |
| Spread | -2.4 |
| Total | 49.1 |
| Wind | 4.3 |
| Home | 52.4% |
Because this is an average, it could be the product of a couple running backs whose teams were big underdogs making the cut. But that wasn't the case.
There were 42 running backs in perfect lineups this year. Only one of them was a 10-point underdog. That kicks out the "outlier bringing down the average" theory.
Instead, the bigger effect was that there weren't many heavily favored backs to push things the other direction. Only two of those 42 were on teams favored by at least 10 points, making that sample smaller than the percentage of teams favored by that much for the full season.
| Spread | Perfect RBs | Overall |
|---|---|---|
| Favored by 10 or More | 4.8% | 6.1% |
| Favored by 5 to 9.5 | 33.3% | 19.0% |
| Favored by Less Than 5 | 31.0% | 25.0% |
| Underdogs by Less Than 5 | 16.7% | 25.0% |
| Underdogs by 5 or More | 14.3% | 25.0% |
That goes counter to our narratives around running backs, but it's still unlikely to be a fluke. That's due to the role pass-catching played in getting backs into perfect lineups.
Of the aforementioned 42 running backs in perfect lineups, only one had no receptions in the game. Only seven backs failed to record multiple receptions. The highest-upside games are the ones where the backs get production both as a rusher and as a receiver.
That's why we see fewer monster games out of teams that are heavily favored. If you're running late to drain clock, that back isn't getting those high-value targets. It's possible they've already done enough work to pay off their salary, but that doesn't mean they've had a true ceiling performance. In our pursuit of ceiling above all else, that matters.
This is not to say we need to actively avoid running backs on teams that are heavily favored. However, if a rush-first back is heavily favored, they're likely to be a super popular option. The running backs who made a perfect lineup without multiple receptions averaged 163.6 rushing yards and 1.7 touchdowns per game, meaning the bar to make it without catching passes is massive. As such, there are worse ideas than being lower than consensus on that player, instead focusing on players who project to catch more passes in a tighter script.
The passing-game volume remained steady even with backs like McCaffrey and Barkley missing most of the year. The bigger impact of their absence is that it allowed more lower-salaried backs to make the cut, as the average salary of perfect backs dipped to $7,086 from $7,231 last year. Most of those lower-salaried options -- not surprisingly -- were catching passes.
Overall, there were 22 running backs with salaries below $7,000. The rushing-yardage split between the two groups was huge. Things were pretty even through the air, though.
| Salary | Rush Yards | Rush TDs | Rec | Rec Yards | Rec TDs | FD Points |
|---|---|---|---|---|---|---|
| $7,000 or Higher | 143.6 | 2.0 | 3.5 | 35.6 | 0.2 | 32.3 |
| $6,900 or Lower | 97.4 | 1.4 | 4.0 | 29.3 | 0.4 | 25.7 |
This means we should feel much better trusting low-salary backs when they have pass-catching chops. That's true of all backs, but it seems even more important down here.
The other takeaway from that table is that you still need a ton of points to make a perfect lineup no matter what your salary may be. Only two running backs made a perfect lineup with fewer than 20 FanDuel points, and they were at 19.8 and 17.5. Even if a running back is the minimum salary of $4,500 on FanDuel, if they don't have a path to 20 points, you need to look elsewhere.
Not surprisingly, a tighter spread helped the value backs, too. The average spread of the $6,900 and lower group was -2.1 compared to a mark of -2.7 for their higher-salaried counterparts. Only one of the lower-salaried backs came from a team favored by more than 7.5 points.
If we're seeking out floor, we can turn to run-first backs and backs on teams that are heavily favored. The anecdotes around those players exist for a reason, and they likely do have a better floor projection.
But as discussed at the top, we can't settle for a good floor anymore. We need a player who can move the needle all by themselves. At running back this year, that was largely guys who caught passes and were in projected tighter scripts, especially if they were lower-salaried. We don't have to ignore the backs who aren't in that mold, but this should be the new blueprint at running back going forward.
Wide Receivers
Given the prevalence of wide receivers in the game-stack section, it should come as no surprise that the takeaways here will be similar. We want to sell out for projected high-scoring, tight games.
| Perfect WRs | Averages |
|---|---|
| Salary | $6,532 |
| FanDuel Points | 27.1 |
| Roster Rate | 9.0% |
| Spread | -1.1 |
| Total | 50.6 |
| Wind | 3.2 |
| Home | 57.6% |
That 1.1-point spread is the tightest of any position by 1.3 points, and the total is second only to the quarterbacks. Seems pretty straightforward.
Similar to quarterbacks, it was just as important to avoid low-total games as it was to target those with a high total. Of the 59 receivers in perfect lineups, only one came from a game with a total of 43 or lower.
| Total | Perfect WRs | Overall |
|---|---|---|
| 53.5 or Higher | 30.5% | 12.9% |
| 48.5 to 53 | 40.7% | 34.8% |
| 43.5 to 48 | 27.1% | 40.6% |
| 43 or Lower | 1.7% | 11.7% |
Although only 47.7% of all games had a total of 48.5 or higher, they produced 71.2% of the perfect wide receivers. You need pretty extreme circumstances to get excited about a wide receiver in a game that's not expected to feature a bunch of points.
Even with the dip in running-back salaries, we still saw plenty of low-salaried wide receivers make the perfect lineup. Nearly two-thirds (64.4%) of the perfect wide receivers had a salary of $6,900 or lower, including 35.6% of them at $5,900 or lower. Those lower-salaried receivers were on an average of just 6.1% of rosters in the FanDuel Sunday Million compared to 14.4% for the higher-salaried options.
That tells us we should look for low-salaried contrarian wide receivers but not much else. It doesn't tell us what kinds of low-salaried receivers we should look for. The data tells us it should be the big-play options.
Here's a breakdown of the output by perfect wide receivers based on their salary. Both groups averaged more than 25 FanDuel points; they just got there in different fashions.
| Salary | Rec. | Rec. Yards | Rec. TDs | FD Points |
|---|---|---|---|---|
| $7,000 or Higher | 10.1 | 137.1 | 1.7 | 29.8 |
| $6,900 or Lower | 7.2 | 119.2 | 1.5 | 25.7 |
The value receivers averaged 16.6 yards per reception. It was 13.5 for the studs. Nine of 38 lower-salaried options had 5 or fewer receptions; nobody in the upper tier had fewer than 7.
That also means that an upper-tier receiver needed massive volume to be worthwhile, but you generally don't get into that range without swimming in targets. As a result, we can leave that point there. But the viability of big-play threats in the value range is intriguing.
This data is a good argument against rostering the Danny Amendola-type receivers. Sure, they might have a good floor. But only one receiver made a perfect lineup this year without having at least 100 yards from scrimmage or two touchdowns. If you can't envision a player you're considering hitting either of those marks, you should omit them from your player pool.
There will be some selection bias in this. Players make a perfect lineup only when they hit the high end of their range of outcomes, and those downfield threats are going to have plenty of dud games that won't show up on this sheet. However, our intent here is to find upside, so we have to be willing to take some risks. Those deep-ball receivers are worth it in the right circumstances.
The specific circumstance we want them in is a tight script. Here's another breakdown of the perfect wide receivers by salary, and the big-play threats thrived most when the game was projected to be close.
| Perfect WRs by Salary | $7,000 or Higher | $6,900 or Lower |
|---|---|---|
| Home | 66.7% | 52.6% |
| Spread | -2.9 | -0.1 |
| Total | 51.3 | 50.3 |
| Roster Rate | 14.4% | 6.1% |
In total, 60.5% of the lower-salaried perfect receivers came from games with a spread of fewer than five points in either direction. That's compared to 50% of all NFL games that fit in that range. Whether they were at home or on the road didn't matter. It was all about getting them in the right game environment.
This gives us two related scenarios in which we should bump up a big-play, lower-salaried receiver. We should covet them when they're in a potential shootout or when we're already stacking the game. Those two will often go hand-in-hand.
Based on the game-stacking section, we'll want our receivers to be tied to other players in our lineups fairly often. We can use that as a crutch when trying to decide which of the volatile receivers we want to target. If we're considering a player of that mold in a lesser game environment, it's wise to give that play a second thought.
The final thing worth noting here is the wind speed in the top chart. The average wind speed for a game that produced a perfect wide receiver was 3.2 miles per hour, the lowest of any position.
| Position | Average Wind Speed |
|---|---|
| Quarterback | 5.1 |
| Running Back | 4.3 |
| Wide Receiver | 3.2 |
| Tight End | 6.9 |
| Defense and ST | 3.8 |
The average wind speed for all NFL games this year was 7.1 miles per hour, meaning every position -- including defense and special teams -- was below that. The average for defenses in 2019 perfect lineups was 8.7, though, so we can likely chalk that part up as variance. For the receivers, though, it's something we've seen every year.
For the full season, 29.3% of all NFL games had wind speeds of at least 10 miles per hour. Those games produced just 6.8% of receivers in perfect lineups.
| Wind Speed | Perfect WRs | Overall |
|---|---|---|
| 0 to 4 mph | 74.6% | 34.0% |
| 5 to 9 mph | 18.6% | 36.7% |
| 10 to 14 mph | 0.0% | 17.6% |
| 15-Plus mph | 6.8% | 11.7% |
It may feel as though people get too anxious about wind speeds, and you'll often see pushback on analyzing wind on Twitter. But the data says high-upside receivers rarely come from blustery games, so any anxiety around players in suboptimal weather conditions is warranted.
Tight Ends
For most positions, we can use the data to find clear-cut, process-oriented takeaways that we can easily apply to 2021 lineups.
At tight end? Not so much.
| Perfect TEs | Averages |
|---|---|
| Salary | $5,782 |
| FanDuel Points | 20.2 |
| Roster Rate | 7.1% |
| Spread | -3.7 |
| Total | 48.6 |
| Wind | 6.9 |
| Home | 41.2% |
Their average total is in line with the league-wide number, the wind speed is high, and their home-road split deviated heavily from every other position. Fun!
One thing that does pop up here is that finding a close game was less important. The spread was the heaviest of any position, and heavily favored teams did produce a good number of perfect tight ends.
| Spread | Perfect TEs | Overall |
|---|---|---|
| Favored by 10 or More | 11.8% | 6.1% |
| Favored by 5 to 9.5 | 29.4% | 19.0% |
| Favored by Less Than 5 | 29.4% | 25.0% |
| Underdogs by Less Than 5 | 17.6% | 25.0% |
| Underdogs by 5 or More | 11.8% | 25.0% |
This is decently easy to explain, as well. Tight end -- more than any position except potentially quarterback -- is dependent on touchdowns. They don't pump out a ton of yardage, so they need to hit paydirt to come through. You're more likely to do that on a team that's favored than an underdog. So, that's probably a sticky takeaway.
One thing you'll note is that the spread distribution at tight end is very similar to quarterbacks. That's not a big surprise. After all, 5 of 17 perfect tight ends (excluding Taysom Hill the week he made it at tight end despite being the New Orleans Saints' starting quarterback) were stacked with their quarterback. So, naturally, you'd expect those positions to mesh well here.
This gives a second potential takeaway for tight end. Once we pick our quarterback, we should give heavy consideration to pairing them with their tight end.
This doesn't have to come at the expense of a receiver, either. As mentioned earlier, there were three instances where three-plus teammates were stacked in the same lineup. Two of those three involved a tight end. Going super heavy on a team seems more viable when the players you're using are not competing with each other as directly for production. There is obviously overlap between a tight end and a receiver, but the overlap is lesser than with two receivers.
The numbers at the top are for tight ends as a whole. That means we're looking at both Travis Kelce and the lower-level guys, who are basically playing different positions. We know we want to use Kelce, but what process should we follow if we decide to dip down?
There's actually a solid sample here. Of our 17 non-Hill perfect tight ends, 12 carried salaries of $5,900 or lower. Five of those were in the $4,000 range. Here's the secret sauce behind those 12 players.
| Low-Salaried Perfect TEs | Averages |
|---|---|
| Receptions | 5.8 |
| Yards | 85.1 |
| Touchdowns | 1.3 |
| Spread | -1.3 |
| Total | 47.6 |
| Home | 41.7% |
In this split, we did see the prevalence of tighter spreads spring back up. Seven of 12 (58.3%) lower-salaried perfect tight ends came from games with a spread of fewer than five points, again a healthy tick up from the league-wide mark of 50.0%. Kelce twice made a perfect lineup while favored by double digits; no other tight end did so even once. That helps explain why the spread was so large.
The one thing that doesn't change is the total. In fact, the average total for the lower-salaried tight ends was actually lower than the league-wide mark. There were even four players who were underdogs in games with a total of 46 or lower, making it tougher to lean on implied totals for tight-end selection.
One final interesting dynamic with the lower-salaried plays is something we talk about most often at running back: players benefiting from role changes. Four of the 12 lower-salaried tight ends were stepping into larger roles, whether it be a natural increase in snaps or an injury to a fellow pass-catcher. Three of the four changes were things we knew about going into that week. If you can identify a lower-salaried tight end who projects to run more routes than he has in previous weeks, the data says we should be inclined to take a swing.
Overall, we need to lump our tight ends into two separate buckets. For the studs, we want to view them similarly to quarterbacks, seeking out high totals and not caring too much about whether they're heavily favored. For the value plays, we want to seek out role changes and players in projected tight games. We should also give extra consideration to stacking our tight end with our quarterback when the situation arises.
We're still unlikely to hit at a high rate at such a volatile position, but we are at least putting ourselves in the right circumstances to identify high-ceiling days.
Defenses and Special Teams
If you're annoyed with all the talk of targeting tight games, you're likely looking forward to a reprieve as we finish up at defense. After all, that's a position where we want to target teams that are heavily favored in games with low totals, which is largely the antithesis of what we've discussed so far.
If that's where your head's at right now, I've got bad news for you.
| Perfect DSTs | Averages |
|---|---|
| Salary | $4,065 |
| FanDuel Points | 20.6 |
| Roster Rate | 6.2% |
| Spread | -2.6 |
| Total | 47.3 |
| Wind | 3.8 |
| Home | 76.5% |
Sorry. It's still all about the close games.
Parts of our process are correct. We don't want to target teams that are big underdogs because it means they won't be seeing pass attempts from the opposing team. The easiest routes to scoring points on defense are sacks, interceptions, and touchdowns, and you're not going to find that on a team that's a big underdog. That did show up in the data.
| Spread | Perfect DSTs | Overall |
|---|---|---|
| Favored by 10 or More | 17.6% | 6.1% |
| Favored by 5 to 9.5 | 11.8% | 19.0% |
| Favored by Less Than 5 | 29.4% | 25.0% |
| Underdogs by Less Than 5 | 41.2% | 25.0% |
| Underdogs by 5 or More | 0.0% | 25.0% |
So, if a team is a big underdog, you can cross them off unless you think the bookmakers are way off. Easy peasy.
It's that middle section that should get your attention, though. Although only 50.0% of games had a spread of less than five points, they produced 70.6% of the perfect defenses. The most popular range was defenses that were slight underdogs. That's very much counter to the narrative here, even if there were a good number of heavily favored teams that made the cut.
This is a good spot to circle back to the discussion we had with quarterbacks about spotting inefficiencies in decision-making. We can determine that by looking at the three most popular defenses each week in the FanDuel Sunday Million. If we compare those popular defenses to the ones that cropped up in the perfect lineup, we see a massive difference in the two numbers.
| Spread | Popular DSTs | Perfect DSTs | Overall |
|---|---|---|---|
| Favored by 10 or More | 31.4% | 17.6% | 6.1% |
| Favored by 5 to 9.5 | 52.9% | 11.8% | 19.0% |
| Favored by Less Than 5 | 15.7% | 29.4% | 25.0% |
| Underdogs by Less Than 5 | 2.0% | 41.2% | 25.0% |
| Underdogs by 5 or More | 0.0% | 0.0% | 25.0% |
Only once the entire season was an underdog team among the three most popular defenses. But those teams were in the perfect lineup seven times. It seems we've found our inefficiency.
The table also shows that we're overzealous in targeting teams that are heavily favored. Sure, we're likely to get a good floor there because they'll likely allow minimal points and pick up a few sacks here and there. But the true ceiling performances are more wide open.
The other interesting thing to note is the salary on these defenses. The average was right around $4,000, and almost half the perfect options checked in with even lower marks.
| Salary | Perfect DSTs |
|---|---|
| $4,500 or Higher | 4 |
| $4,000 to $4,400 | 5 |
| $3,500 to $3,900 | 7 |
| $3,400 or Lower | 1 |
They weren't true punts, but we also weren't forking over top dollar at all times.
This is another area where the perfect lineup data differed from what was popular. The average salary of the popular defenses was $4,478, more than $400 higher than what was in the perfect lineup. Almost one-quarter (23.5%) of the popular defenses had a salary of $5,000 or higher, but none of them made the perfect lineup.
Spending minimal salary at defense has always been preferable in cash games because the marginal salary you can use elsewhere is so valuable. The thought process, though, was that you could spend up in tournaments, assuming that those defenses would go overlooked as everyone loaded up on the lower-end options. The data tells us this isn't the case, though. It seems like peppering the mid-range, trying to identify games with tight spreads that will feature action for all four quarters is an easy way to make our lineups different from the crowd without allocating a bunch of salary here.
Totals can be of minimal concern for us when picking defenses. There weren't many super high-totaled games in perfect lineups, but the overall distribution was similar to the NFL average.
| Total | Perfect DSTs | Overall |
|---|---|---|
| 53.5 or Higher | 5.9% | 12.9% |
| 48.5 to 53 | 35.3% | 34.8% |
| 43.5 to 48 | 47.1% | 40.6% |
| 43 or Lower | 11.8% | 11.7% |
For the most part, the total doesn't need to be a focal point within our defensive selection process.
Targeting defenses in tight scripts is risky because they're more likely to let up a bunch of points and give us a rough output. But as we discussed at the top, focusing on floor is a good way to lose money in daily fantasy. The data tells us that the route to a good ceiling is in targeting competitive games, and the public doesn't treat the position as such. As the number of edges in daily fantasy shrinks thanks to the abundance of information and analysis available, we have to take advantage to any lingering inefficiencies. We've got them here, making that risk much easier to tolerate.


