


Analyzing Trends in FanDuel's 2019 Perfect Daily Fantasy NFL Lineups


This year's shootout between the San Francisco 49ers and New Orleans Saints was a beauty.
The Saints jumped out to a 20-7 lead to start the second quarter, and it looked like they were going to coast to victory and put themselves on the right track for a first-round bye. There was a lot of game left, but they were in control.
Then the points just kept on coming. It was long touchdown after long touchdown, and the 49ers exited the second quarter with a 28-27 lead. By the end, 94 total points had been scored, capping off the most exciting game of the regular season. It was hard not to be jacked up watching that one go down.
Unless you were under-exposed in daily fantasy.
There is no more helpless feeling than watching a shootout play out when you know you didn't dabble enough in the players involved. What should be a joyous game instead turns into a dumpster fire, and your bankroll is supplying the fuel.
Anecdotally, it's pretty easy to see why games like this would be profitable for DFS. If one side is scoring points, it forces the other team to keep its foot on the gas all the way to the end. And as long as the score is close enough, neither team is able to pack it in until the final whistle. That's exactly what we want.
This was a common thread throughout the 2019 season: close games bred big scores in daily fantasy. If you didn't have exposure to those monster outputs, it was onto the next week.
We can get evidence of this by checking out perfect lineups from each week, which you can find on numberFire the next day. Perfect lineups show us the best lineup we could have possibly built while staying beneath the salary cap, which can oftentimes be meaningless over a one-week sample. But if you zoom out and look at the broader picture, it can give you a template for what you want to search for when filling out a roster.
That's what we're going to do here today, digging through the perfect lineups from all 17 regular-season slates and trying to find any commonalities and trends that consistently popped up. Then, we'll look at how we can apply that to our lineups in 2020.
And you can bet we'll be talking plenty about games similar to that barnburner between the 49ers and Saints.
If you prefer an audio version of this post, check it out here via the numberFire Daily Fantasy Podcast Feed or on Apple Podcasts, Spotify, or Stitcher.
Game Stacking
A perfect lineup is not an environment that's conducive to game stacking, or stacking in general. You're looking at just the must-haves at each position, meaning that if the top wide receiver's quarterback is only the third highest-scorer for the slate, that stack won't show up in the perfect lineup.
Even with that being true, stacks and game stacks were abundant in our optimal outcomes this year.
We'll start with the game stacks, which are defined as being multiple players from the same game with at least one coming from each team. That 49ers-Saints game included all of Drew Brees, Michael Thomas, Jared Cook, and Emmanuel Sanders, and it was not a rarity for the season.
Across 17 perfect lineups, there were 20 total game stacks in 2019. Not all of them included four players from one game (out of nine total roster slots), but game stacks were a staple.
The only slates that didn't have a single game stack were Weeks 1 and 17. There were multiple game stacks in a single perfect lineup in Weeks 4, 7, 8, and 16, including a whopping three game stacks in Week 7. And again, this is a format that will naturally undersell the importance of game-stacking.
If you add it all up, 50 of 153 roster slots (32.7%) in perfect lineups from this past season were part of a game stack. That number goes up to 36.0% if you take defense and special teams out of the equation. Those numbers were up slightly from 31.4% and 34.6%, respectively, last year, but the larger point is that a good chunk of players who wind up in perfect lineups are tied to players on the opposing team.
This should make it obvious that game-stacking is something we want to do when filling out our tournament lineups. The next two questions revolve around how we decide which games to stack and which positions on opposing teams pair together best.
The "which games do we stack" portion gets back to what we talked about in the open: there's a ton of value in back-and-forth affairs. It also helps if they're projected to be higher-scoring.
Because we don't have the benefit of foresight when filling out a lineup, we're going to look exclusively at what bookmakers said going into games. This can give us an idea of whether that information is valuable in predicting which games will be profitable investments for DFS. Turns out, people who set odds are good at what they do.
Here's a look at the spreads for each of the 20 games from which game stacks in perfect lineups came. In order to measure the value of this, it's also important to see how often all games from the 2019 season were in these various ranges. If the game stacks were more abundant in one range than the full-season sample would lead you to believe, it would signal to us that those were the games we wanted to stack.
| Spread | Game Stacks | All Games |
|---|---|---|
| 0 to 4.5 | 65.00% | 50.39% |
| 5 to 9.5 | 30.00% | 33.20% |
| 10 or Higher | 5.00% | 16.41% |
Although 50.39% of all games had a spread of less than five points, that sample supplied 13 of our 20 game stacks in perfect lineups. In other words, close games were good. That part should be fairly obvious, but the split here illustrates just how profitable it was to invest in those projected tighter games.
It's also noteworthy how rare it was for a game stack to come from a game with a spread of 10 points or higher. The only time a projected blowout produced a couple in a perfect lineup was in Week 13 when the Philadelphia Eagles were 10.5-point favorites over the Miami Dolphins. That game wound up being a 37-31 win for the Dolphins, and both DeVante Parker and Alshon Jeffery made the perfect lineup that week. It was projected to be more one-sided, but a tight score allowed both guys to show up big.
There are going to be times where you think a game with a larger spread is going to wind up being closer than billed. In those instances, it could make sense to stack that game, hoping both teams put up points and keep it tight until the end. But we need to stack close games, and those are more likely to come from those with a smaller spread.
The other, less surprising element is that these game-stacked games tended to come from contests with high totals. Here's the same table as above, except with those totals instead of the spreads.
| Total | Game Stacks | All Games |
|---|---|---|
| 50 or Higher | 10.00% | 10.16% |
| 45 to 49.5 | 55.00% | 44.92% |
| 40 to 44.5 | 30.00% | 34.38% |
| Lower Than 40 | 5.00% | 10.55% |
If we combine the top two rows, 65.00% of the perfect lineup game stacks were in games with a total of 45 or higher compared to 55.08% of games overall. Again, it's obvious, but it's important.
The more important way to view this likely revolves around the games at the bottom end of that sample. It should make clear how hesitant we should be to use players in projected lower-scoring games, whether they're part of a game stack or not.
Usually, games with low totals have low totals for a reason. It could be due to pace concerns, a pair of bad offenses, wind, or a concern about one team keeping pace with the other. These are all factors that can lead to a bad game environment, and bookmakers tend to do a good job of quantifying those negatives.
If you find yourself gravitating toward a game stack in a game with a low total, ask yourself why the total is so low. If you can find a reason to brush off those concerns and see a path to a big game, then you may want to target that one and get some players at lower popularity. But if you don't see a path to that game going over the total and shooting out, it's likely best to look elsewhere.
Combining those two things together, we want to target projected high-scoring games with tight spreads. Of the 20 games that were featured with game stacks in perfect lineups, 18 checked at least one of these boxes, and eight (40.00%) checked both. Only 30.47% of all games this year checked both boxes, so there's a big incentive to go hard at these contests. And, yes, 49ers versus Saints fit the mold with the Saints favored by one in a game with a 45-point total.
Once you've identified the games you want to stack, the next step is identifying the proper combination of players on each team. There's no perfect answer to this because everybody benefits if it's a shootout, but there are some commonalities.
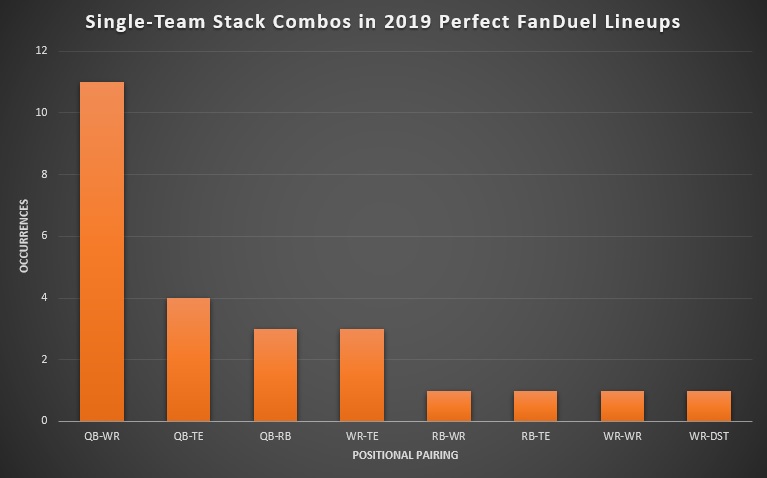
In total, there were 30 different combinations of game stacks from this past season. Here's how often each positional pairing popped up across those 30 game stacks.

The most common was one team's running back paired with the opposing team's wide receiver. That was also the most common combination in last year's perfect lineups, and it's easy to explain anecdotally. If one team is ahead, it gives extra ground-game volume to their running back and forces the other team to air it out. The correlation there is easy to spot, and it should be a pairing we utilize often.
Wide receivers on each team were the second most popular this year, and it was tied for third last year. These tended to be the super high-scoring affairs with all of the double-receiver pairings coming from games with a total of 45 or higher. Again, it's pretty easy to see why this would happen.
A pairing that's less logical anecdotally is a running back on both teams. If both teams are running a bunch, that keeps the clock running and drains game time in a hurry. We could also see the volume of one side being muted if they're trailing.
That's less of a concern now than it would have been five years ago. As outlined by numberFire's JJ Zachariason on The Late-Round Podcast, running backs are more involved in the passing game now than they were previously, meaning the guys who get work as pass-catchers aren't as dependent on game script breaking their way. It should be no shock, then, that Christian McCaffrey was involved in two of the four dual-running back game stacks.
There are certain positions that mesh well together, specifically pairing players who would both benefit if a game goes a certain way. Those should be our most popular stacking routes. But even if it doesn't necessarily make sense logically, we should be pairing high-usage players on both teams if the game is projected to be close and high-scoring. The allure and profitability of game stacks seems unlikely to go down any time soon.
Single-Team Stacks
If you were worried about the chaos of the game stacks with non-correlated positions being paired together, fret not. Single-team stacks were exactly what you'd expect.
Overall, there were 17 instances this year in which players on the same team wound up in the perfect lineup. Four of those times included three players from the same team while the other 13 were all just two players. There were no instances in which a four-player stack (the maximum you can have on FanDuel) made the perfect lineup.
Once we divide out the three-player stacks, there were 25 total combinations of teammates in perfect lineups this year. A whopping 18 of them included the team's quarterback.
The perfect quarterback was stacked with at least one player on his team in 14 of 17 weeks. Weirdly, none of the three exceptions were Lamar Jackson, who does a ton of damage with his legs and was the perfect quarterback twice. You can make a case for rolling out Jackson by himself, but most other guys require a stacking partner tied to them.
A lot of times, this is going to be the wide receiver. That happened 11 times this year and seven last year, and it makes complete sense. But there were also four quarterbacks stacked with a tight end and three with a running back, so it certainly doesn't have to be a receiver.
The three running backs paired with a quarterback in a perfect lineup were Devonta Freeman, Saquon Barkley, and Derrick Henry. They fit into the two buckets where it makes sense to stack a quarterback and a running back.
The first is the Freeman and Barkley bucket where the back is heavily involved in the passing game. Freeman had two receiving touchdowns in his perfect lineup appearance, and Barkley had 90 yards and a touchdown through the air when he made it. The pass-catching backs allow you to double-dip on yardage and potentially touchdowns with the quarterback, so the pairing there makes sense.
You don't get the double-dip with Henry; he had just one reception the week he was stacked with Ryan Tannehill. But by using the two together, you're getting access to almost every yard and likely every touchdown the team accumulates during the game. If they have a huge day, you're going to benefit from almost every play they run. If a running back doesn't fit in either of those buckets, it's a bit of a tougher sell, but these two scenarios make a quarterback with his running back a solid option.
As you may have expected, tight games weren't quite as necessary with single-team stacks as they were with the game stacks. Instead, the spreads here tell us how rare it is for an underdog team to blow up a slate.
| Spread | Stacks |
|---|---|
| Favored by 10 or More | 2 |
| Favored by 5 to 9.5 | 5 |
| Favored by 1 to 4.5 | 8 |
| Underdogs by 1 to 4.5 | 1 |
| Underdogs by 5 or More | 1 |
Both times an underdog team produced teammates in the perfect lineup, they actually wound up winning the game. As you'll see later on, it's not a bad idea to use players on teams that aren't favored, and you inherently must do so if you're stacking both sides of a game. However, going all-in on a team projected to lose seems to be a more questionable tactic.
The big overlap between the game stacks and single-team stacks was the importance of avoiding games with low totals.
| Total | Stacks |
|---|---|
| Total of 50 or Higher | 3 |
| Total of 45 to 49.5 | 7 |
| Total of 40 to 44.5 | 7 |
| Total Below 40 | 0 |
Even if a team is heavily favored, bad game environments just aren't conducive to monster fantasy games. We should be wary of any game bookmakers tell us will be low-scoring, even if one team still carries a respectable implied total.
If we're going to combine the past two sections together, our resolution for 2020 should be to target close, higher-scoring games with regularity. We should be wary of games that project to be less fantasy-friendly, even if we're looking at just one team in the game. Once we've whittled our list of games down a bit, then we can start to dig into which specific positions fit best with our single-team and full-game stacks.
The Flex Position
As with stacking, zeroing in on how the flex was utilized in perfect lineups will be an imperfect practice. We're getting the best of the best rather than focusing on the 75th-percentile outcomes that we can expect out of players, which is going to skew things a bit.
With that being said, things broke pretty much as you'd expect in this year's perfects.
| Position | Times Flexed in Perfect Lineup |
|---|---|
| Running Back | 11 |
| Wide Receiver | 6 |
| Tight End | 0 |
This is a format that should be more conducive to wide receivers because they are more volatile than running backs. That means we should view even the six times a receiver made it with a bit of skepticism. But overall, the preference for running backs here is in line with what you'd expect.
In last year's perfect lineups, it was a running back in the flex 10 times compared to four times for wide receivers and three times for tight ends. The biggest appeal of running backs is that they have more predictable volume, making their range of outcomes easier to pinpoint. That doesn't matter when you're looking at perfect lineups. Still, they've popped up in this slot 61.76% of the time since FanDuel introduced the flex in 2018, so we'll definitely want to plug in a third running back for tournament lineups more often than not.
Quarterbacks
The first big thing with quarterbacks is something we already mentioned: you're going to want to stack them almost without fail. Even in a format that doesn't show the full advantages of stacking, that is abundantly clear.
Beyond that, what did the average perfect quarterback look like in 2019? Here's an overall view of that. The "roster rate" row refers to the percentage of rosters the quarterback was on in that week's FanDuel Sunday Million, numbers premium subscribers can get each week on numberFire.
| Perfect Quarterbacks | Averages |
|---|---|
| Salary | $7,859 |
| FanDuel Points | 34.50 |
| Home | 41.18% |
| Spread | -4.0 |
| Total | 46.4 |
| Wind | 5.3 |
| Roster Rate | 7.49% |
In the betting world, the performance of road teams was a hot topic of conversation as they covered at an abnormal rate, especially early in the season. Perfect quarterbacks seemed to follow a similar trend.
The abundance of road quarterbacks in the perfect lineup was very much a new occurrence this year as the past two years' perfect lineups had skewed more toward the home teams.
| Year | Perfect QBs At Home |
|---|---|
| 2017 | 58.82% |
| 2018 | 58.82% |
| 2019 | 41.18% |
Because it's a sample of 17 quarterbacks each year, it's very much within the realm of possibilities that this is simply variance, and things will revert back to normal next year. We have to be careful not to overreact. But there are still some interesting potential takeaways.
The big one should be that there is big appeal in quarterbacks who are favored on the road. Of the 10 road quarterbacks to make a perfect lineup, eight entered the game as favorites, and several of them were pretty heavily so. This does go a bit counter to our insistence on targeting exclusively close games, but that may be less of a necessary edict when it's the road team that is favored.
The other takeaway is that we may not need to be as wary of road teams as we have been in the past, especially if bookmakers are viewing them favorably. It's still a discussion you should have with yourself, asking whether a team is deceptively attractive, but there are several data points indicating that home field advantage may not be as important as it once was. We'll want to conduct this process in conjunction with looking at spreads and totals, but we can lower our guard against road quarterbacks at least a smidge based on what we saw this year.
Outside of the preference for road quarterbacks, there was one more deviation from what we've seen in past seasons. That was a higher total output by the perfect quarterbacks.
Here's a look at the average statline of a perfect quarterback the past three seasons. We saw a major boost in scoring last year, and that upward trend continued in 2019.
| Year | Passing Yards | Passing TDs | Rushing Yards | Rushing TDs | FD Pts |
|---|---|---|---|---|---|
| 2019 | 347.8 | 4.0 | 22.4 | 0.5 | 34.50 |
| 2018 | 340.9 | 3.1 | 34.2 | 0.8 | 33.94 |
| 2017 | 331.9 | 3.5 | 22.8 | 0.3 | 30.90 |
As you can see, the average in 2017 was 30.90. Only four quarterbacks in 2019 perfect lineups scored less than that number, and four quarterbacks topped 40 FanDuel points. Scoring is very clearly on the rise, and we've got to account for that.
When picking a quarterback for a tournament, you need to make sure they have a path to a monster game. That could be the Jackson or Josh Allen route where they get there via rushing production, or it could be with a 429-yard, 5-touchdown day like Aaron Rodgers. If they don't have a path to a game like that, they really have no business being in your lineup.
Rushing seemed to be especially key for identifying cheaper quarterbacks with upside. Of the nine perfect quarterbacks with a salary below $8,000, five had at least one rushing touchdown, two had multiple, and three players had 40 yards on the ground. Early in the season, we should be hunting for cheaper players who add to their floor and ceiling with their rushing abilities and be aggressive in buying them before their salaries go up.
Rushing production was also important in relation to game environment. Nine quarterbacks made the perfect lineup in a game with a total of 46 or higher. They combined for one rushing touchdown. That's compared to seven rushing touchdowns from eight quarterbacks in games with a total below that number.
Basically, we need quarterbacks to check one of two boxes. They need to either be in a positive game environment with the potential for points on both sides, or they need to provide production with their rushing. If a quarterback doesn't check either of those boxes, then we should think long and hard about whether they have the necessary upside to win a tournament.
Running Backs
This past year was a profitable one for DFS players who invested in mid- and low-priced running backs, a deviation from what we've seen in past years. The average salary of perfect running backs was $7,231, down from $7,545 last year.
| Perfect Running Backs | Averages |
|---|---|
| Salary | $7,231 |
| FanDuel Points | 30.5 |
| Home | 46.67% |
| Spread | -0.4 |
| Total | 45.3 |
| Wind | 6.9 |
| Roster Rate | 11.81% |
There were 13 perfect running backs with a salary of $8,000 or higher; last year, there were 20. That's a pretty major shift.
We could take this to mean that we should be looking to pay down at running back going forward. Once we dig deeper into the cheaper running backs who did make the cut, we'll see that's true... as long as a certain set of conditions are met. Otherwise, the expensive ones are still the best investment.
This past season, 21 running backs made a perfect lineup with a salary below $7,000. Of those 21, 13 experienced some sort of role change either before the game or during it (with a teammate getting hurt, for example). In other words, those 13 running backs didn't have salaries that reflected the roles they wound up playing during that game.
If you look at the other eight who didn't get a role change, they all had something in common: they were involved in their team's passing offense. They averaged 4.1 receptions per game in the weeks they made the perfect lineup, which is not a small number by any means.
This was something that was true for almost all perfect running backs. Very few made the cut without at least some contributions in the passing game.
| Receptions | Perfect RBs |
|---|---|
| 5-Plus Receptions | 16 |
| 3 to 4 Receptions | 19 |
| 1 to 2 Receptions | 8 |
| 0 Receptions | 2 |
We'll talk about the exceptions to this shortly. But first, back to those cheaper backs.
Here's a breakdown of the statlines for the cheaper running backs versus their more costly counterparts. There was a massive split in rushing production between the two, but both groups were getting targets.
| Perfect Running Backs | Rush Yds | Rush TDs | Receptions | Rec Yds | Rec TDs | FD Pts |
|---|---|---|---|---|---|---|
| Salary of $7,000 or Higher | 130.5 | 1.6 | 4.5 | 43.9 | 0.3 | 31.0 |
| Salary Below $7,000 | 98.7 | 1.7 | 4.3 | 44.3 | 0.5 | 29.8 |
At least some involvement in the ground game was still required, so we're not talking about true satellite backs in this sample. But it's clear that catching passes is a massive key for running backs, regardless of salary, and it's something we should seek out when searching for bargains.
If we know going into a game that a lower-salaried running back is moving into an expanded role that will include work as a pass-catcher, we should be aggressive in buying them. You would think everyone else would do the same, but it wasn't really the case. Of the 13 role-change running backs, 10 were role changes we knew of before the game. Those running backs were on just 10.05% of rosters on average, and only one of them was on more than 13% of rosters. This is an edge the public isn't exploiting as much as it should. Even if it requires a leap of faith on our part, we should be looking to invest in cheaper running backs with role changes that include work in the passing game.
With that said, there were obviously some exceptions to the always-catch-passes rule. And it wasn't just Derrick Henry snatching souls down the stretch.
You just needed a Henry-esque performance to make a perfect lineup without work as a receiver.
As you saw above, there were 10 running backs who made a perfect lineup with two or fewer receptions. Those 10 backs averaged 143.6 rushing yards and 2.5 rushing touchdowns per game. Yowza.
When you're not catching passes, you're losing a bunch of free points and one of your easiest paths to big yardage. To compensate, you've got to go absolutely bananas as a rusher. So, if you're considering a back who doesn't bathe in targets, you need to ask whether they have the ability to go off for a 120-yard, multi-touchdown day. If not, then they likely lack the upside necessary to vault you to the top of the leaderboards.
Potentially because these backs were more involved in the passing game, the spread was less important than you'd think. The average perfect running back came from a team that was favored by just 0.4 points, and only 53.33% of our perfect backs were on teams that were favored. Instead, they tended to come from those close games we were slobbering on before.
Of our 45 perfect backs, 28 (62.22%) came from games with a spread of less than five points in either direction. As a reminder, only 50.39% of all games this year fit into that window. Only 6 of 45 running backs (13.33%) came from games with spreads larger than 7.5 points, a deviation from 20.70% of all games with spreads that large.
Narratively, we should want running backs on teams that are heavily favored because it would figure to give them additional rushing volume down the stretch. That volume certainly isn't a bad thing. However, if it comes at the expense of targets -- which are worth twice as much as carries on a half-PPR site like FanDuel -- being a heavy favorite might not be as beneficial as it seems.
Because pass-catching is less valuable on FanDuel than sites with full-PPR scoring, we may have a tendency to discount it in our minds when evaluating backs of different archetypes, targeting one-dimensional backs when playing on FanDuel. However, the data shows that pass-catching is still hyper-valuable even in this format. We should not be targeting these rush-only backs on FanDuel unless we think they have the potential to go absolutely bonkers on the ground.
Our takeaways at running back from these perfect lineups are pretty cut and dry. First, we should target lower-salaried running backs who are experiencing role changes. Second, we should be especially eager to use those players if we can reasonably expect them to get work as receivers, something that is borderline necessary for a back regardless of their salary. Third, if you're not going to catch passes, you had better have a path to a ton of rushing yardage and touchdowns. Finally, close games are valuable here thanks to the increased potential for receptions, and we shouldn't bump backs up just because their teams are heavily favored.
It's very possible that we'll go through that checklist and be unable to find any backs who fit our requirements with bargain salaries. As last year showed, it's often superbly profitable to load up on the higher-salaried options. We should, though, keep a close eye out for the cheaper options who meet our requirements and plug them in liberally.
Wide Receivers
Game environment was a key in finding players who would be profitable in game stacks, and wide receivers were pretty common in said game stacks. It should be no surprise, then, that game environment played a key role in wide receiver selection.
Here's the overview of the position in perfect lineups in 2019.
| Perfect Wide Receivers | Averages |
|---|---|
| Salary | $6,470 |
| FanDuel Points | 28.8 |
| Home | 49.12% |
| Spread | -1.3 |
| Total | 46.2 |
| Wind | 5.1 |
| Roster Rate | 9.89% |
The average total at 46.2 won't stand out much because the league-wide average total for 2019 was 45.2. It's more so when you see the buckets from which these wide receivers came.
| Total | Perfect WRs | All Games |
|---|---|---|
| Total of 50 or Higher | 14.04% | 10.16% |
| Total of 45 to 49.5 | 52.63% | 44.92% |
| Total of 40 to 44.5 | 31.58% | 34.38% |
| Total Below 40 | 1.75% | 10.55% |
Although only 55.08% of all games had a total of 45 or higher, 66.67% of all perfect wide receivers came from that group. That's a major gap, and it means this should be one of our main points of emphasis at the position.
Perhaps more important than targeting the high-scoring games is avoiding the low-scoring slogs. Terry McLaurin was the only wide receiver to make a perfect lineup from a game with a total lower than 41, and he had the fifth-lowest FanDuel-point total for any receiver in a perfect lineup. In a lot of weeks, he might not have made the cut. Getting pop games from receivers in bad game environments is a rarity.
Looking at perfect lineups is naturally going to push us toward rostering lower-salaried wide receivers. It's a volatile position where you don't have to be the team's top option to blow up, giving the position a different dynamic than running back. This is -- in part -- why 22 wide receivers made the perfect lineup with a salary below $6,000.
What we can learn from perfect lineups, though, is which conditions are conducive to a lower-salaried wide receiver lighting it up. That way, we know roughly what we should be looking for when trying to pinpoint guys who could pay off next year.
The table below compares those cheaper receivers to their expensive counterparts who made perfect lineups in 2019. What we want to find is the area where these two groups differ, ideally giving us an archetype we should target.
| Perfect WRs | Salary of $6,000 or Higher | Salary Below $6,000 |
|---|---|---|
| FanDuel Points | 28.7 | 29.0 |
| Receptions | 8.7 | 7.2 |
| Receiving Yards | 144.4 | 131.5 |
| Receiving TDs | 1.7 | 2.0 |
| Home | 48.57% | 50.00% |
| Spread | -2.0 | -0.2 |
| Total | 46.7 | 45.3 |
| Roster Rate | 12.05% | 6.46% |
The first thing that should stand out is that the cheaper wide receivers still had as many FanDuel points as the others; the two just took different routes for getting there.
The cheap wide receivers feasted on big plays, averaging 18.3 yards per reception. For the more expensive players, that number was 16.6 yards per reception. They just had more of those receptions to bridge the gap.
Anecdotally, this makes sense. Bigger-play wide receivers are going to be more volatile, pushing their salaries lower. But their ceilings are still really good, meaning a pop game is within their range of outcomes.
This tracks when you look at some of the specific names, too. DeSean Jackson made it in Week 1, and he's the prototype for this kind of player. You also had Marquise Brown, John Brown, DJ Chark, Marvin Jones, and John Ross all in here, and those are guys who get volume downfield and can convert it into touchdowns. That's obviously a major advantage for this type of format.
Another thing that stands out with the cheaper receivers -- circling back to our big theme -- is that many of them were in projected tight contests. A whopping 15 of the 22 (68.18%) were in games with a spread of less than five points.
Both of those points popped up in last year's perfect lineups, as well. It was the more volatile receivers who made the cut in this salary range, and 64.00% of them came from projected tight games. This gives us a pretty good blueprint for next year. If we see a wide receiver with big-play ability in a game with the potential to shoot out, we should feel good about being aggressive with them, even while acknowledging that their floor is inherently low.
As we shift the focus back to the position as a whole, this year once again reiterated the importance of having major upside, similar to what we saw at quarterback.
In our 2017 perfect lineup breakdown, we set a threshold wide receivers needed to hit in order to make a perfect lineup. They needed to have the ability to get either 85-plus receiving yards or two-plus touchdowns. If they couldn't hit either of those marks, they didn't carry the upside to be worthy of a perfect lineup.
Last year, only one wide receiver made a perfect lineup while falling short of those benchmarks. This year, it was one again, and that exception came on a lower-scoring Week 17 slate.
As such, this is likely a threshold we should continue to consider when checking out receivers for DFS. If they don't have yardage or multi-touchdown upside, you're best suited pushing your exposure elsewhere.
Tight Ends
Based on things we've discussed so far, what would you guess is the ideal blueprint for a tight end? Would you say players in high-scoring, tightly contested games have an edge?
If so, gold star for you.
| Perfect Tight Ends | Averages |
|---|---|
| Salary | $5,782 |
| FanDuel Points | 20.6 |
| Home | 47.06% |
| Spread | -0.9 |
| Total | 45.3 |
| Wind | 3.9 |
| Roster Rate | 8.53% |
Of our 17 perfect tight ends, 11 (64.71%) came from games with a spread of less than five points.
| Spread | Perfect TEs |
|---|---|
| Favored by 10 or More | 2 |
| Favored by 5 to 9.5 | 1 |
| Favored by 1 to 4.5 | 6 |
| Underdogs by 1 to 4.5 | 5 |
| Underdogs by 5 to 9.5 | 3 |
And 12 of them (70.59%) were in games with a total of 45 or higher.
| Total | Perfect TEs |
|---|---|
| Total of 50 or Higher | 1 |
| Total of 45 to 49.5 | 11 |
| Total of 40 to 44.5 | 2 |
| Total Below 40 | 3 |
Hopefully, this point has been driven home by now. But just in case it hasn't, say it with me one last time: game environment matters.
Now that we've got that out of the way, let's move on to other things. There seemed to be two different types of tight ends who made perfect lineups this year. The first was someone who had legit involvement in his offense, earning him a salary somewhere around $6,000 or higher. The other was the bargain-bin variety who allowed you to pay up elsewhere.
| Salary | Perfect TEs |
|---|---|
| $7,000 or Higher | 0 |
| $6,000 to $6,900 | 10 |
| $5,000 to $5,900 | 3 |
| Lower than $5,000 | 4 |
This is not a way of saying that tight ends with salaries of $7,000 or higher are bad options, as long as they have wide receiver-levels of involvement. They just didn't happen to pay off big this year. Let's tackle the other buckets.
As mentioned, the $6,000 range is players with legit involvement in their offenses. Austin Hooper and Mark Andrews both made it twice while in that range, if that paints a better picture. There's value in that type of player.
The $5,000 range was sort of a no-man's land. Only three made it to the perfect lineup from there this year, and two of those three were Tyler Higbee when his role was spiking at the end of the year. He had the role of someone in the $6,000 range while carrying salaries in the $5,000 range. Mike Gesicki was the other, and you could argue that he was in the same mold as Higbee where his salary was underrating his role.
This should show us the downsides of targeting players in the $5,000 range. They don't bring the upside of those in the $6,000 range nor the salary savings of the cheaper players, so unless you expect their role to go up, they seem to be a bit of a trap.
As far as the cheap guys, all four had a snap rate of at least 79.5% the week they made the cut. They weren't in super attractive games or target monsters on the team; they just happened to be on the field a bunch. So if you see a cheaper player with a good snap rate who is running a bunch of routes down in the bargain bin, you can feel free to take a swipe at them. Getting that player in a favorable game environment would obviously not be a bad thing, but here, it may not be as much of a prerequisite for a profitable investment.
Defense and Special Teams
We'll get to the formula for a great defense and special teams in a second. But first, one number on the overall breakdown for the position provides a springboard to a broader discussion.
| Perfect DSTs | Average |
|---|---|
| Salary | $4,235 |
| FanDuel Points | 23.9 |
| Home | 41.18% |
| Spread | -2.8 |
| Total | 44.8 |
| Wind | 8.7 |
| Roster Rate | 7.39% |
That number is the average wind speed at 8.7 miles per hour. It's a massive jump up from what we saw at other positions.

Weird that the average wind speed was lowest at the positions most dependent on the passing game, right? You would almost think that weather matters.
In case you're worried about small samples, this has been true in every year we've looked at perfect lineups. Here's how often perfect players at each position made the perfect lineup based on the range of the wind speed from 2017 through 2019.
| Wind Speeds | QBs | RBs | WRs | TEs | DSTs |
|---|---|---|---|---|---|
| 0 to 5 mph | 56.86% | 51.22% | 57.06% | 59.26% | 41.18% |
| 6 to 10 mph | 33.33% | 32.52% | 27.61% | 31.48% | 33.33% |
| 11-Plus mph | 9.80% | 16.26% | 15.34% | 9.26% | 25.49% |
It's absolutely not impossible for a quarterback or wide receiver to blow up in a game that's blustery. You can see as much in that table. But in DFS, we're trying to find any edge we can get, and being at least underweight on players in those negative conditions seems to be the best route.
Now, back to the defenses and special teams. Here, the generic checklist at the position is finding teams that are favored in low-scoring games. And if you're looking for the teams that will give you the best average output, that's likely correct. It's a bit different when you're searching purely for upside, though.
Here's the spread breakdown for perfect defenses.
| Spread | Perfect DSTs |
|---|---|
| Favored by 10 or More | 3 |
| Favored by 5 to 9.5 | 3 |
| Favored by 1 to 4.5 | 6 |
| Underdogs by 1 to 4.5 | 4 |
| Underdogs by 5 to 9.5 | 1 |
And here are the totals.
| Total | Perfect DSTs |
|---|---|
| Total of 50 or Higher | 2 |
| Total of 45 to 49.5 | 6 |
| Total of 40 to 44.5 | 7 |
| Total Below 40 | 2 |
Things weren't entirely in line with other positions. The spread for defenses was the most negative for any position outside of quarterback, and the total was the lowest. So they definitely mattered. They just might not have been as important as you may have thought.
For example, throughout the entire 2019 season, there were 26 games with a total of 50 or higher. Two of them produced a defense in the perfect lineup. There were also two defenses from games with a total below 40 even though there were technically more of those games (27) than there were games with a total of 50 or higher.
This does not mean we should actively seek out games with high totals when selecting defenses for DFS. It does, however, mean we shouldn't cross them off, especially if we think there will be a ton of drop backs in the game. The more drop backs there are, the more chances we get for sacks, strip sacks, and picks. That's exactly what we should want.
That's one of the downsides of games with bad environments. Sometimes, a lower total is due to a slow pace. That could be because one or both of the teams are super run-heavy. When that's the case, it lowers the projected drop backs for the game, decreasing the odds we hit the high end on the range of outcomes. The floor for defenses in those games will be solid because they're unlikely to allow a bunch of points, but you need access to sacks and picks if you want to notch a true difference-making score.
When it comes to salaries, the discussion about cash games versus tournaments is also pertinent. In a cash game, it's likely wise to spend down at the position because the predictability of defenses is lower and the realistic range of outcomes is smaller. There are lots of advantages to paying down there. Those advantages are present when looking for upside, too, but we do see a lot of expensive defenses pop up in perfect lineups.
| Salary | Perfect DSTs |
|---|---|
| $4,500 or Higher | 8 |
| $4,000 to $4,400 | 3 |
| $3,500 to $3,900 | 4 |
| Lower than $3,500 | 2 |
The expensive defenses were the ones that fit our usual process of being heavily favored in not-super-high-scoring games. It was with the cheaper defenses where things got a bit wonky.
This data shouldn't impact the way we attack cash games. There, it's likely wise to keep with the same strategy of paying down so that we can splurge elsewhere. But for tournaments, we can see there is value in expensive defenses as long as they fit our traditional process well.
When we do decide to spend down in tournaments, that's where the tighter games seem to be more appealing. Of those six defenses with salaries below $4,000, five came from games with a spread of less than five. That tighter spread likely helped keep their salaries in check, but it doesn't hurt their upside, so those seem to be enticing spots as long as you're okay with having a lower floor.
As we've seen today, every position in DFS seems to benefit from a high-scoring, tight game. Both sides are engaged the entire time, maintaining the potential for a difference-making play for all 60 minutes. As such, when we start doing research for slates in 2020, we should begin by looking at the games bookmakers think have the potential to mimic the 49ers' shootout win over the Saints and go from there.


