


Ryan Fitzpatrick's Week 3 Will Probably Be the Worst Game of the Year


New York Jets quarterback Ryan Fitzpatrick had a bad day in Week 3 against the Kansas City Chiefs.
Maybe that’s a little understated for a game in which he threw six interceptions, but we can all agree the performance was not good. We can also say, pretty definitively, Fitzpatrick had the worst game of this young 2016 NFL season.
By our Net Expected Points (NEP) metric, Fitzpatrick cost the Jets nearly 30 points on Sunday -- 27.23 to be exact.
But in a way, while Fitzpatrick had a terrible game, he wasn’t the sole reason the Jets fell 24-7.
Fitzpatrick's Picks
Fitzpatrick didn’t get around to throwing his second interception of the game until almost the end of the third quarter -- a fact that makes his six-pick day even more impressive. At the time of that interception, the Jets’ win probability was only 14.31 percent, per numberFire Live.
It dropped to 4.59 percent following the interception, but the Jets’ chances of winning the game were slim even before the quarterback started giving the ball away to the other team like candy to a group of trick-or-treaters.
Let’s take a look, then, at the situation for all six of Fitzpatrick’s interceptions.
The table below includes the time each pick was thrown, the down and distance, where the line of scrimmage was on the play, the score at the time of the pick, the Jets’ win probability before the interception, the Jets’ win probability after the interception, and the Net Expected Points lost on each play.
| Interception | Time | Down | LoS | Score | Win% Before INT | Win% After INT | INT Expected Points |
|---|---|---|---|---|---|---|---|
| 1 | 2:30 1Q | 3rd and 9 | NYJ 22 | 0-0 | 42.05% | 36.02% | -2.65 |
| 2 | 1:37 3Q | 2nd and 5 | KC 5 | 3-17 | 14.31% | 4.59% | -5.4 |
| 3 | 8:25 4Q | 2nd and 6 | KC 6 | 3-17 | 8.36% | 1.57% | -5.19 |
| 4 | 4:43 4Q | 4th and 10 | KC 40 | 3-17 | 1.07% | 0.97% | -0.85 |
| 5 | 3:34 4Q | 2nd and 2 | NYJ 49 | 3-17 | 1.63% | 0.04% | -9.2 |
| 6 | 2:00 4Q | 2nd and 7 | KC 17 | 3-24 | 0.08% | 0.00% | -4.54 |
Overall, Fitzpatrick cost the Jets 24.31 percentage points of win probability across his interceptions. While win probability isn’t always linear -- it can go back and forth throughout the game -- in this case, it was pretty close. The win probability graph for this game was pretty slanted towards the Chiefs, though they did start with a 55.32 percent chance of winning, according to our numbers.
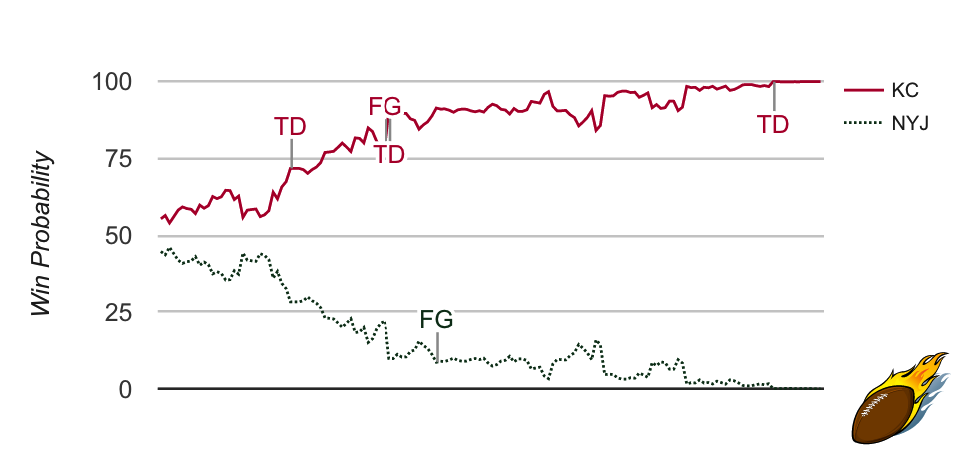
The Jets didn’t do much to change that during the game, knocking it to a low of 53.95 percent with 14:15 left in the first quarter. By the time Fitzpatrick started his fourth-quarter interception party, the Jets already had less than a 10-percent chance of winning the game.
Even Fitzpatrick’s pick-six didn’t have much to do with the actual outcome of the game -- New York’s win probability dropped from 1.63 percent to 0.04.
Fitzpatrick also lost 27.83 expected points on these six interceptions. That does mean that, on his 38 other drop backs, he contributed 0.50 Passing NEP.
Bad and Beatable
Things could always be worse.
While Fitzpatrick’s total Passing NEP wasn’t matched last year, his ineffectiveness on a per drop back basis (-0.62) was beaten five times last season alone. Let’s take a quick look at those games and why they rated so poorly.
For this, a cutoff of 20 drop backs was used, which excludes things like bad trick plays or truly terrible backup quarterback performances with only a few drop backs.
Week 3, Colin Kaepernick: -1.04 Passing NEP/Drop Back, 9 for 19, 67 yards, 0 TD, 4 INT
This was the beginning of the downfall for Kaepernick. He threw for just 3.5 yards per attempt, while he added 4 interceptions in a 47-7 blowout to the Arizona Cardinals. He threw only 19 passes but was sacked twice, which gets him over the 20-drop-back threshold.
Week 5, Nick Foles: -0.69 Passing NEP/Drop Back, 11 for 30, 141 yards, 1 TD, 4 INT
Foles’ numbers here are bad, but they’re not really remarkably bad -- or at least not remarkably bad against what we might remember Nick Foles’ 2015 season to be. He had the one touchdown, a five-yard pass to Tavon Austin, but one of his four interceptions was returned 45 yards for a touchdown. He also was sacked three times by the Green Bay Packers.
Week 10, Peyton Manning: -0.97 Passing NEP/Drop Back, 5 for 20, 35 yards 0 TD, 4 INT
Peyton’s performance against the Chiefs in this game was tough to watch. Little went right, and Manning threw for just 1.75 yards per attempt. He was also sacked twice. Passer Rating isn’t always a great stat, but when someone finishes the game with a rating of 0.0, it’s pretty significant.
Week 12, Tony Romo: -0.81 Passing NEP/Drop Back, 11 for 21, 106 yards, 0 TD, 3 INT
Tony Romo had returned from injury the week prior to help earn a 24-14 win against the Miami Dolphins. But the Thanksgiving showdown against the Carolina Panthers was not a happy ending, and unfortunately Romo has not played in a regular season game since. Two of Romo’s three interceptions were returned for touchdowns -- one by Kurt Coleman and the other by Luke Kuechly.
Week 16, Aaron Rodgers: -0.69 Passing NEP/Drop Back, 15 for 28, 151 yards, 3 TD, 1 INT
Rodgers makes this list while throwing more touchdowns than interceptions. The story of this game against the Cardinals, though, was how bad everything else that wasn’t a touchdown was for the Packers. Rodgers was sacked 8 times in the 38-8 loss, which all count against his per drop back metrics.
None of this is here to lessen the terribleness of Fitzpatrick’s game against the Chiefs, but it does help to show there are many different ways to get to a similar result of bad football.
On Sunday, Ryan Fitzpatrick chose the route of six interceptions to get him there. We’ve seen worse games on a per-play basis somewhat recently, but any other quarterback is going to have his work cut out for him to top Fitzpatrick’s performance from Sunday.


