


NFL Betting: Key Numbers Update From 2020


In our heads, we know the value of key numbers when betting on the NFL.
Whenever a spread is hovering near three points, we're on high alert. If a team total is sniffing 24, we know small movements can go a long way toward dictating our sentiment.
We also broadly know which key numbers matter most, specifically with three and seven popping up so often when betting spreads.
The problem here is that these numbers aren't stagnant. With changes in scoring environment and the aggressiveness of head coaches always shifting, we can't just rely on old data when pinging key numbers in our head. The scoring distribution will be different when the average point total for an NFL game is 49.6 in 2020 versus 45.6 in 2015.
As such, it's important to go back each year, see which numbers popped up most often with spreads, totals, and team totals, and see how that changed from previous seasons. If there's a massive shift that we can expect to stick, it's something we'll want to keep in mind when betting in 2021 and beyond.
The two key aspects here are what happened in 2020 and how that differed from previous seasons. So let's start with the latter and then dive into the former.
Key Numbers in 2020
Anecdotally, it felt like aggression shifted for teams across 2020. It seemed like there were more attempts at two-point conversions and fewer instances where teams settled for field goals.
The data does back that up.
| Year | Two-Point Conversion Attempts | Field Goal Attempts |
|---|---|---|
| 2020 | 131 | 960 |
| 2019 | 113 | 983 |
| 2018 | 129 | 947 |
| 2017 | 82 | 1027 |
| 2016 | 105 | 1009 |
| 2015 | 94 | 987 |
With numbers like three and seven revolving heavily around those two data points, you might think that there would be an opening for the top key numbers to shift. That didn't happen, though. Here are the point differentials that occurred in more than 1% of all NFL games in 2020.
| Point Differential | 2020 Rate |
|---|---|
| 3 | 14.45% |
| 7 | 7.42% |
| 6 | 6.64% |
| 10 | 6.25% |
| 14 | 6.25% |
| 5 | 5.47% |
| 8 | 5.47% |
| 4 | 5.08% |
| 1 | 4.30% |
| 2 | 3.91% |
| 17 | 3.91% |
| 11 | 3.13% |
| 26 | 2.73% |
| 9 | 1.95% |
| 16 | 1.95% |
| 18 | 1.95% |
| 20 | 1.95% |
| 19 | 1.56% |
| 21 | 1.56% |
| 24 | 1.56% |
| 29 | 1.56% |
| 15 | 1.17% |
| 25 | 1.17% |
| 27 | 1.17% |
| 28 | 1.17% |
Even with the kicking game taking more of a backseat, the king stayed the king. Seven retained the second spot, too, so just from a broad perspective, we can continue to view three and seven as being the main talking points when dissecting spreads.
The emphasis on decision-making would be pertinent with team totals, as well. If teams are more reluctant to settle for three, that would impact the scoring distribution there. This is also where we'd see bigger effects of the scoring increase.
The manifestation of this is 27 leap-frogging a couple lower team totals that had previously hovered near the top of the list.
| Team Total | 2020 Rate |
|---|---|
| 27 | 6.84% |
| 20 | 6.64% |
| 17 | 5.66% |
| 23 | 5.66% |
| 31 | 5.27% |
| 24 | 4.88% |
| 30 | 4.69% |
| 16 | 4.30% |
| 34 | 4.30% |
| 26 | 3.52% |
| 28 | 3.52% |
| 38 | 2.93% |
| 21 | 2.73% |
| 10 | 2.34% |
| 19 | 2.34% |
| 25 | 2.34% |
| 33 | 2.15% |
| 37 | 2.15% |
| 7 | 1.95% |
| 14 | 1.95% |
| 35 | 1.95% |
| 3 | 1.76% |
| 13 | 1.76% |
| 9 | 1.56% |
| 41 | 1.56% |
| 22 | 1.37% |
| 32 | 1.37% |
| 36 | 1.17% |
| 40 | 1.17% |
As mentioned, we'll do a full breakdown of how things shifted in the next section. But if you take all games from 2015 through 2020, 27 ranks just fourth among all team totals. This was also the first time in that span that 31 had topped the 5.0% mark.
Key numbers aren't as broadly discussed with full game totals simply because there's a wider range of possibilities there. That leads to no obvious markers like the ones we get with spreads and single-team totals.
We see a justification for this lack of relative interest in the data. No one full-game total occurred more than 5.0% of the time.
| Total | 2020 Rate |
|---|---|
| 44 | 4.69% |
| 40 | 4.30% |
| 51 | 4.30% |
| 54 | 4.30% |
| 43 | 3.91% |
| 39 | 3.52% |
| 45 | 3.52% |
| 49 | 3.13% |
| 58 | 3.13% |
| 57 | 2.73% |
| 59 | 2.73% |
| 71 | 2.73% |
| 30 | 2.34% |
| 37 | 2.34% |
| 46 | 2.34% |
| 65 | 2.34% |
| 33 | 1.95% |
| 34 | 1.95% |
| 41 | 1.95% |
| 42 | 1.95% |
| 47 | 1.95% |
| 48 | 1.95% |
| 52 | 1.95% |
| 63 | 1.95% |
| 64 | 1.95% |
| 29 | 1.56% |
| 32 | 1.56% |
| 50 | 1.56% |
| 55 | 1.56% |
| 61 | 1.56% |
| 66 | 1.56% |
| 67 | 1.56% |
| 26 | 1.17% |
| 38 | 1.17% |
| 56 | 1.17% |
| 60 | 1.17% |
| 62 | 1.17% |
| 69 | 1.17% |
Although there are no clear tentpoles here, it does help illustrate a broader point about why key numbers matter.
Betting a traditional total isn't about projecting the average point total for that game. Outlier cases in either direction can skew that number. We're betting it based on how often a game crosses that total, not by how much. If you're laying -110, the implied odds of that are 52.4%. So if you're betting a game with a total of 49.5 -- right near the NFL scoring average for the entire season -- it's helpful to know 52.7% of all games this year went under that total versus the 47.3% that went over. We're betting probabilities rather than averages, and key numbers play a critical role in determining those distributions.
Where Numbers Shifted
If you're trying to determine key numbers for 2021, focusing on 2020 is likely a good starting point. Thanks to improved quarterback play and more aggressive offenses, the future scoring environment is more likely to reflect 2020 than 2017 or 2018. But there's also the impact of not having fans in the stands, and the NFL seems to change its mind on how to call penalties weekly. This means a more broad view can be beneficial.
Looking back at past seasons can also tell us what was different in 2020. Catching a trend early is unlikely to get us out in front of the sportsbooks (they're analyzing this stuff way more in depth than we are), but it can at least help us avoid silly mistakes.
This is where we can narrow our scope a bit. Realistically, we're not going to bet many games with a spread of more than 20 points (the maximum spread from 2020), so it doesn't matter too much how often a game lands on 21. We care more about how often it hits in the areas in which we'll be betting.
So, let's narrow our list down to just the point differentials that landed between 0 and 20. When doing so, we're going to look at three-year moving averages rather than just one season. This way, we're tripling the sample and accounting for one-year blips in things such as penalty enforcement.
Here it is in tabular form so that you can more easily see the raw percentages and the change over time. The "full sample" column is for all games from 2015 through 2020.
| Point Differential | Full Sample | 15-17 | 16-18 | 17-19 | 18-20 |
|---|---|---|---|---|---|
| 0 | 0.39% | 0.26% | 0.52% | 0.39% | 0.52% |
| 1 | 4.23% | 3.78% | 4.56% | 3.91% | 4.69% |
| 2 | 4.04% | 3.52% | 4.17% | 4.17% | 4.56% |
| 3 | 14.65% | 15.23% | 15.36% | 14.71% | 14.06% |
| 4 | 4.36% | 4.30% | 3.91% | 3.91% | 4.43% |
| 5 | 4.43% | 4.82% | 4.56% | 3.91% | 4.04% |
| 6 | 7.03% | 8.07% | 6.25% | 6.25% | 5.99% |
| 7 | 9.51% | 9.11% | 8.98% | 9.51% | 9.90% |
| 8 | 4.30% | 3.91% | 4.17% | 4.17% | 4.69% |
| 9 | 1.63% | 2.21% | 2.08% | 1.43% | 1.04% |
| 10 | 4.95% | 4.82% | 4.17% | 4.95% | 5.08% |
| 11 | 2.60% | 2.73% | 2.73% | 2.34% | 2.47% |
| 12 | 1.56% | 1.56% | 2.21% | 1.95% | 1.56% |
| 13 | 1.95% | 2.47% | 2.21% | 2.21% | 1.43% |
| 14 | 5.86% | 5.08% | 5.99% | 6.25% | 6.64% |
| 15 | 1.63% | 1.56% | 2.08% | 1.56% | 1.69% |
| 16 | 2.67% | 2.73% | 2.86% | 3.13% | 2.60% |
| 17 | 3.06% | 2.99% | 2.47% | 3.26% | 3.13% |
| 18 | 2.15% | 1.69% | 1.69% | 2.08% | 2.60% |
| 19 | 1.04% | 0.78% | 1.17% | 0.78% | 1.30% |
| 20 | 2.15% | 2.60% | 2.47% | 2.47% | 1.69% |
You can use that in tandem with this chart, which makes more obvious where the key number spikes occur in the distribution.

Both the table and the chart reinforce that we still need to view three and seven as being the focal points when discussing key numbers. There were some noteworthy movements in the more recent seasons, though.
There were nine numbers that hit their peak in the three-year sample from 2018 through 2020: 1, 2, 4, 7, 8, 10, 14, 18, and 19. The numbers to hit their lowest marks in that span were 3, 6, 9, 13, 16, and 20. Notice any trends?
It seems as if the decline in the kicking game did erode some of the stranglehold that three had at the top. The king did stay the king, but its crown lost some luster.
We also saw dips in other field-goal-centric differentials. Although 12 didn't set a new low in 2018 through 2020, it tied its low in this span. Only two games in 2020 ended with a 12-point differential, the 26th most common point-differential.
In the most basic sense, key numbers were driven less by field goals and more by touchdowns than in years past. There was also an increase in the prevalence of differentials surrounding the traditional key numbers, potentially due to the increased prevalence of two-point conversion attempts. This could all swing back in the future, but with teams' philosophies shifting steadily one direction, that seems unlikely.
We don't want to go overboard with takeaways here. Even in the 2018 to 2020 split, we still saw 24.0% of all games land on either three or seven. They're still the key numbers to focus on. But upping the importance of numbers surrounding three and seven while lowering our emphasis on numbers driven by field goals seems wise.
When digging into past data on team totals, the change in scoring environment becomes much more apparent.
In the section on 2020, it was noted that 27 was the most common team total for the year. That was not the case for the full sample where 20 popped up most regularly.
| Team Total | Full Sample | 15-17 | 16-18 | 17-19 | 18-20 |
|---|---|---|---|---|---|
| 16 | 4.33% | 4.49% | 4.62% | 4.36% | 4.17% |
| 17 | 6.25% | 6.32% | 6.51% | 6.51% | 6.18% |
| 18 | 0.91% | 0.91% | 0.91% | 0.98% | 0.91% |
| 19 | 2.25% | 2.67% | 2.15% | 1.82% | 1.82% |
| 20 | 6.90% | 7.36% | 6.32% | 6.64% | 6.45% |
| 21 | 3.42% | 3.19% | 3.84% | 3.71% | 3.65% |
| 22 | 1.66% | 1.69% | 1.76% | 1.63% | 1.63% |
| 23 | 5.08% | 5.14% | 5.34% | 5.08% | 5.01% |
| 24 | 6.45% | 6.45% | 6.51% | 7.23% | 6.45% |
| 25 | 1.37% | 1.43% | 1.37% | 0.78% | 1.30% |
| 26 | 3.29% | 3.19% | 3.19% | 3.26% | 3.39% |
| 27 | 6.22% | 6.12% | 6.05% | 5.73% | 6.32% |
| 28 | 2.83% | 2.47% | 2.67% | 2.54% | 3.19% |
| 29 | 1.37% | 1.43% | 1.63% | 1.50% | 1.30% |
| 30 | 3.61% | 3.78% | 3.39% | 3.19% | 3.45% |
| 31 | 4.26% | 3.78% | 4.04% | 4.17% | 4.75% |
| 32 | 0.91% | 0.78% | 0.72% | 0.65% | 1.04% |
| 33 | 2.18% | 2.41% | 2.34% | 2.08% | 1.95% |
| 34 | 3.19% | 2.73% | 2.86% | 3.19% | 3.65% |
Clearly, 27 hit its peak in 2020. But so did a bunch of numbers surrounding it. You can see that in the chart below where the light blue line represents the stretch from 2018 to 2020.

The numbers hitting their peak in 2018 through 2020 were 26, 27, 28, 31, 32, and 34. The minimums were at 16, 17, 18, 19, 23, 29, and 33. We also saw tied lows for 19 and 24. So, yeah, scoring played a big role here.
The changes in team totals, thus, are more systemic than with spreads. There, we saw minor changes based on alterations in decision-making. Here, there has been a tangible shift in where the main key numbers lie. As a result, we actually should look to reset our expectations of what the key numbers are in the market.
As such, let's re-do both the table and the chart above, focusing on just the data from 2018 through 2020.
| Team Total | 2016 to 2018 Rate |
|---|---|
| 16 | 4.17% |
| 17 | 6.18% |
| 18 | 0.91% |
| 19 | 1.82% |
| 20 | 6.45% |
| 21 | 3.65% |
| 22 | 1.63% |
| 23 | 5.01% |
| 24 | 6.45% |
| 25 | 1.30% |
| 26 | 3.39% |
| 27 | 6.32% |
| 28 | 3.19% |
| 29 | 1.30% |
| 30 | 3.45% |
| 31 | 4.75% |
| 32 | 1.04% |
| 33 | 1.95% |
| 34 | 3.65% |
The updated graph makes more obvious the increased relevance of the higher point totals.
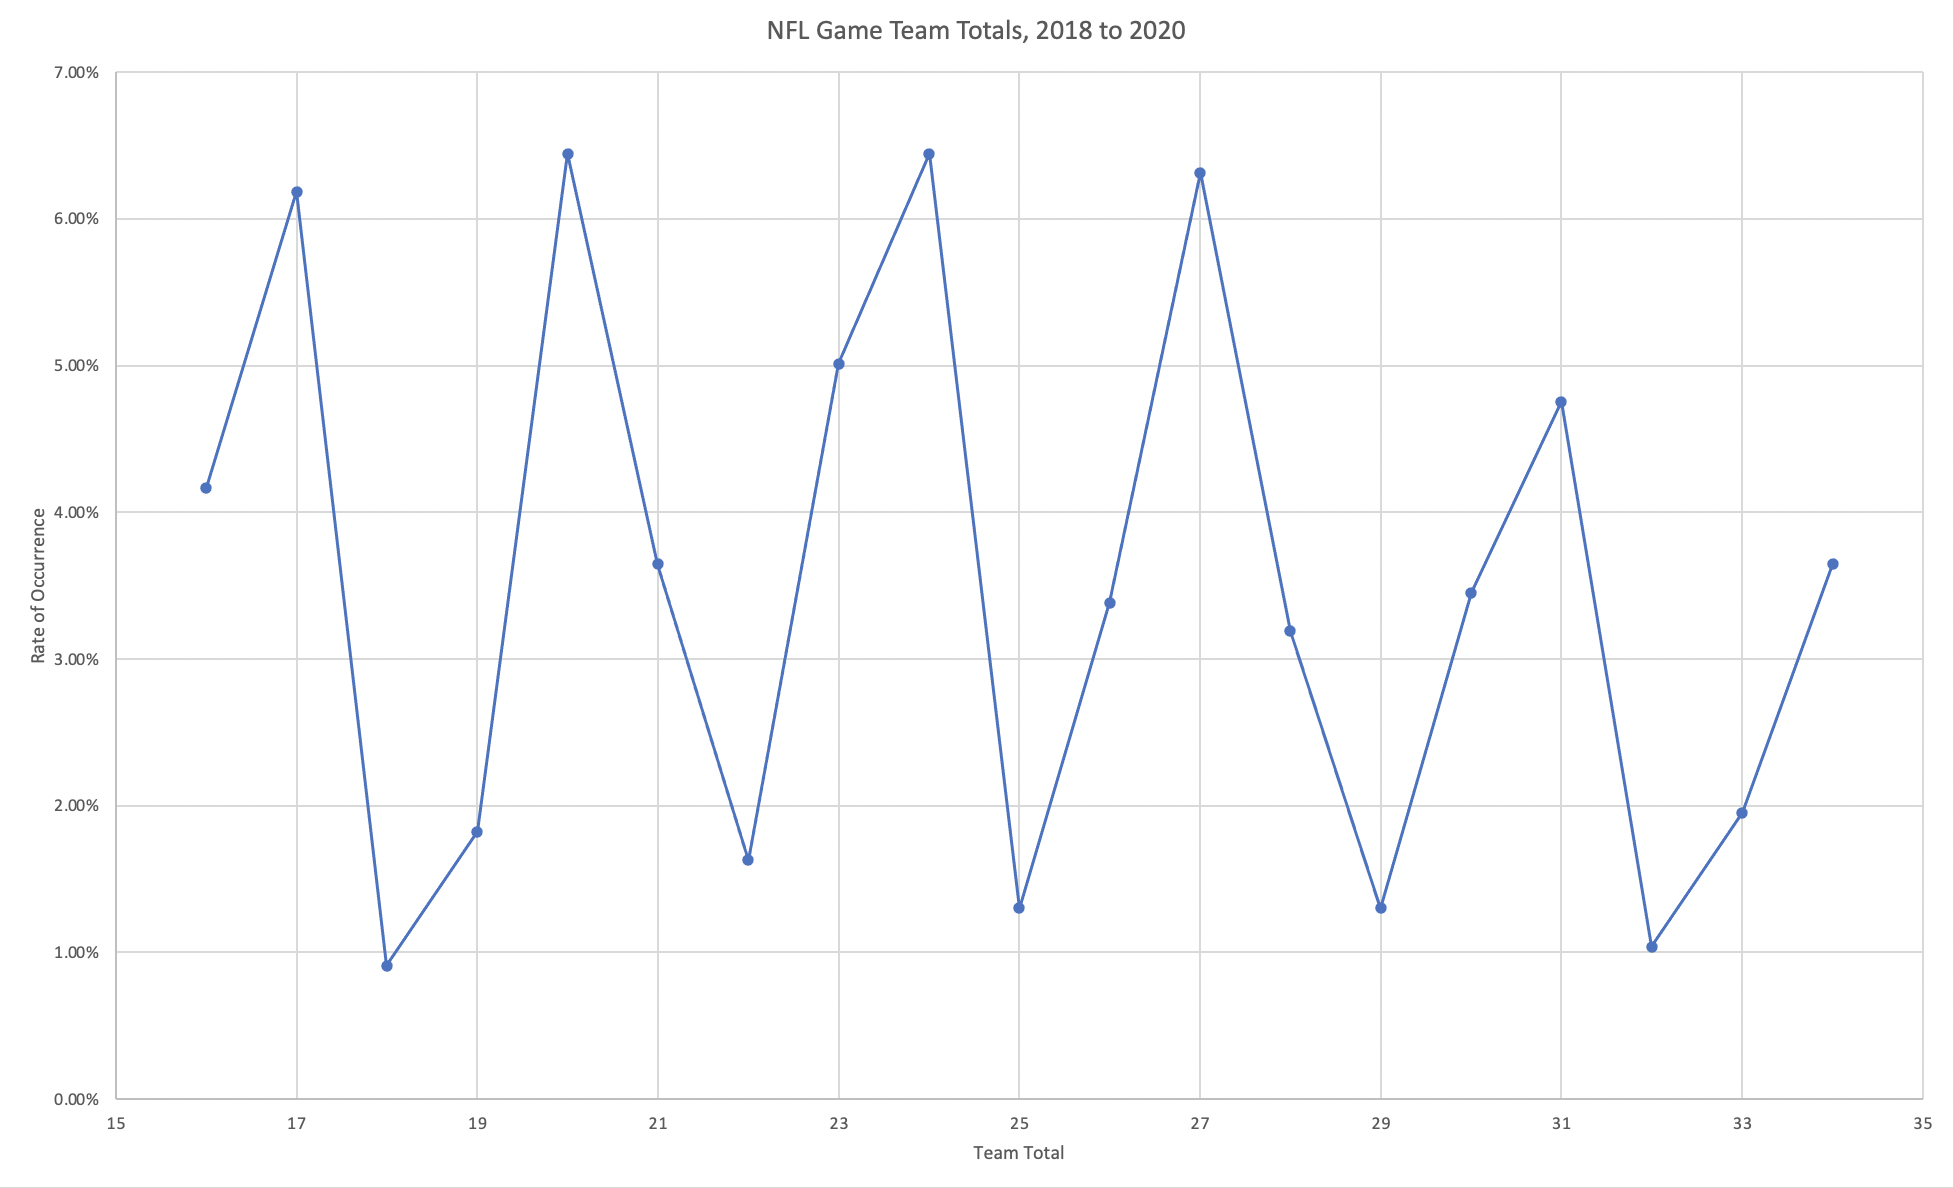
Whereas spreads had two key spikes, team totals have four. All of 17, 20, 24, and 27 occurred more than 6.0% of the time, and 23 was the only other to occur at higher than a 5.0% clip.
The numbers outside of that deserving of mention are 31 and 34. They're not going to have the same league-wide prominence as 20 given the firepower it takes to get there, but they matter plenty when we're betting team totals on quality offenses. There are decent dead zones from 28 to 30 and then 32 to 33, so movement in those ranges doesn't need to concern us all that much. But if we get movement that crosses either 31 or 34, that should alter our perspective of the number.
The game total market is a blend of the other two. We saw a heavier emphasis on touchdown-centric totals, and the overall scoring environment was elevated.
The totals that hit their three-year peak in 2018 through 2020 were 42, 44, 49, 56, 58, and 59. Three of those six are directly tied to touchdowns. The numbers to hit their lows in 2018 through 2020 were 38, 41, 47, 48, 50, 53, and 55.
| Total | Full Sample | 15-17 | 16-18 | 17-19 | 18-20 |
|---|---|---|---|---|---|
| 38 | 1.63% | 1.82% | 1.56% | 1.69% | 1.43% |
| 39 | 2.34% | 2.34% | 2.47% | 1.82% | 2.34% |
| 40 | 3.84% | 3.65% | 3.52% | 4.30% | 4.04% |
| 41 | 3.52% | 3.65% | 3.78% | 3.65% | 3.39% |
| 42 | 1.82% | 1.69% | 1.82% | 1.82% | 1.95% |
| 43 | 3.45% | 4.04% | 2.60% | 2.73% | 2.86% |
| 44 | 3.58% | 2.86% | 2.99% | 3.13% | 4.30% |
| 45 | 2.60% | 2.60% | 2.60% | 2.21% | 2.60% |
| 46 | 2.41% | 2.60% | 2.47% | 2.08% | 2.21% |
| 47 | 3.26% | 3.65% | 3.91% | 3.39% | 2.86% |
| 48 | 2.41% | 2.60% | 2.99% | 2.47% | 2.21% |
| 49 | 2.67% | 2.60% | 2.73% | 2.47% | 2.73% |
| 50 | 3.06% | 3.13% | 3.39% | 3.52% | 2.99% |
| 51 | 3.71% | 2.99% | 4.04% | 4.56% | 4.43% |
| 52 | 1.95% | 1.95% | 2.08% | 2.34% | 1.95% |
| 53 | 1.17% | 1.43% | 1.17% | 1.04% | 0.91% |
| 54 | 2.67% | 2.73% | 2.21% | 1.43% | 2.60% |
| 55 | 2.99% | 3.13% | 2.99% | 2.99% | 2.86% |
| 56 | 1.17% | 1.04% | 1.17% | 1.17% | 1.30% |
| 57 | 2.54% | 2.34% | 2.73% | 2.47% | 2.73% |
| 58 | 1.82% | 1.04% | 1.69% | 2.08% | 2.60% |
| 59 | 1.37% | 1.04% | 1.30% | 1.30% | 1.69% |
| 60 | 0.91% | 1.04% | 0.39% | 0.52% | 0.78% |
Here's the graph view to visualize where the spikes occurred.

Things are all over the place depending on which range you're focusing on. So, as with point totals, let's narrow things down to just what we saw from 2018 to 2020.
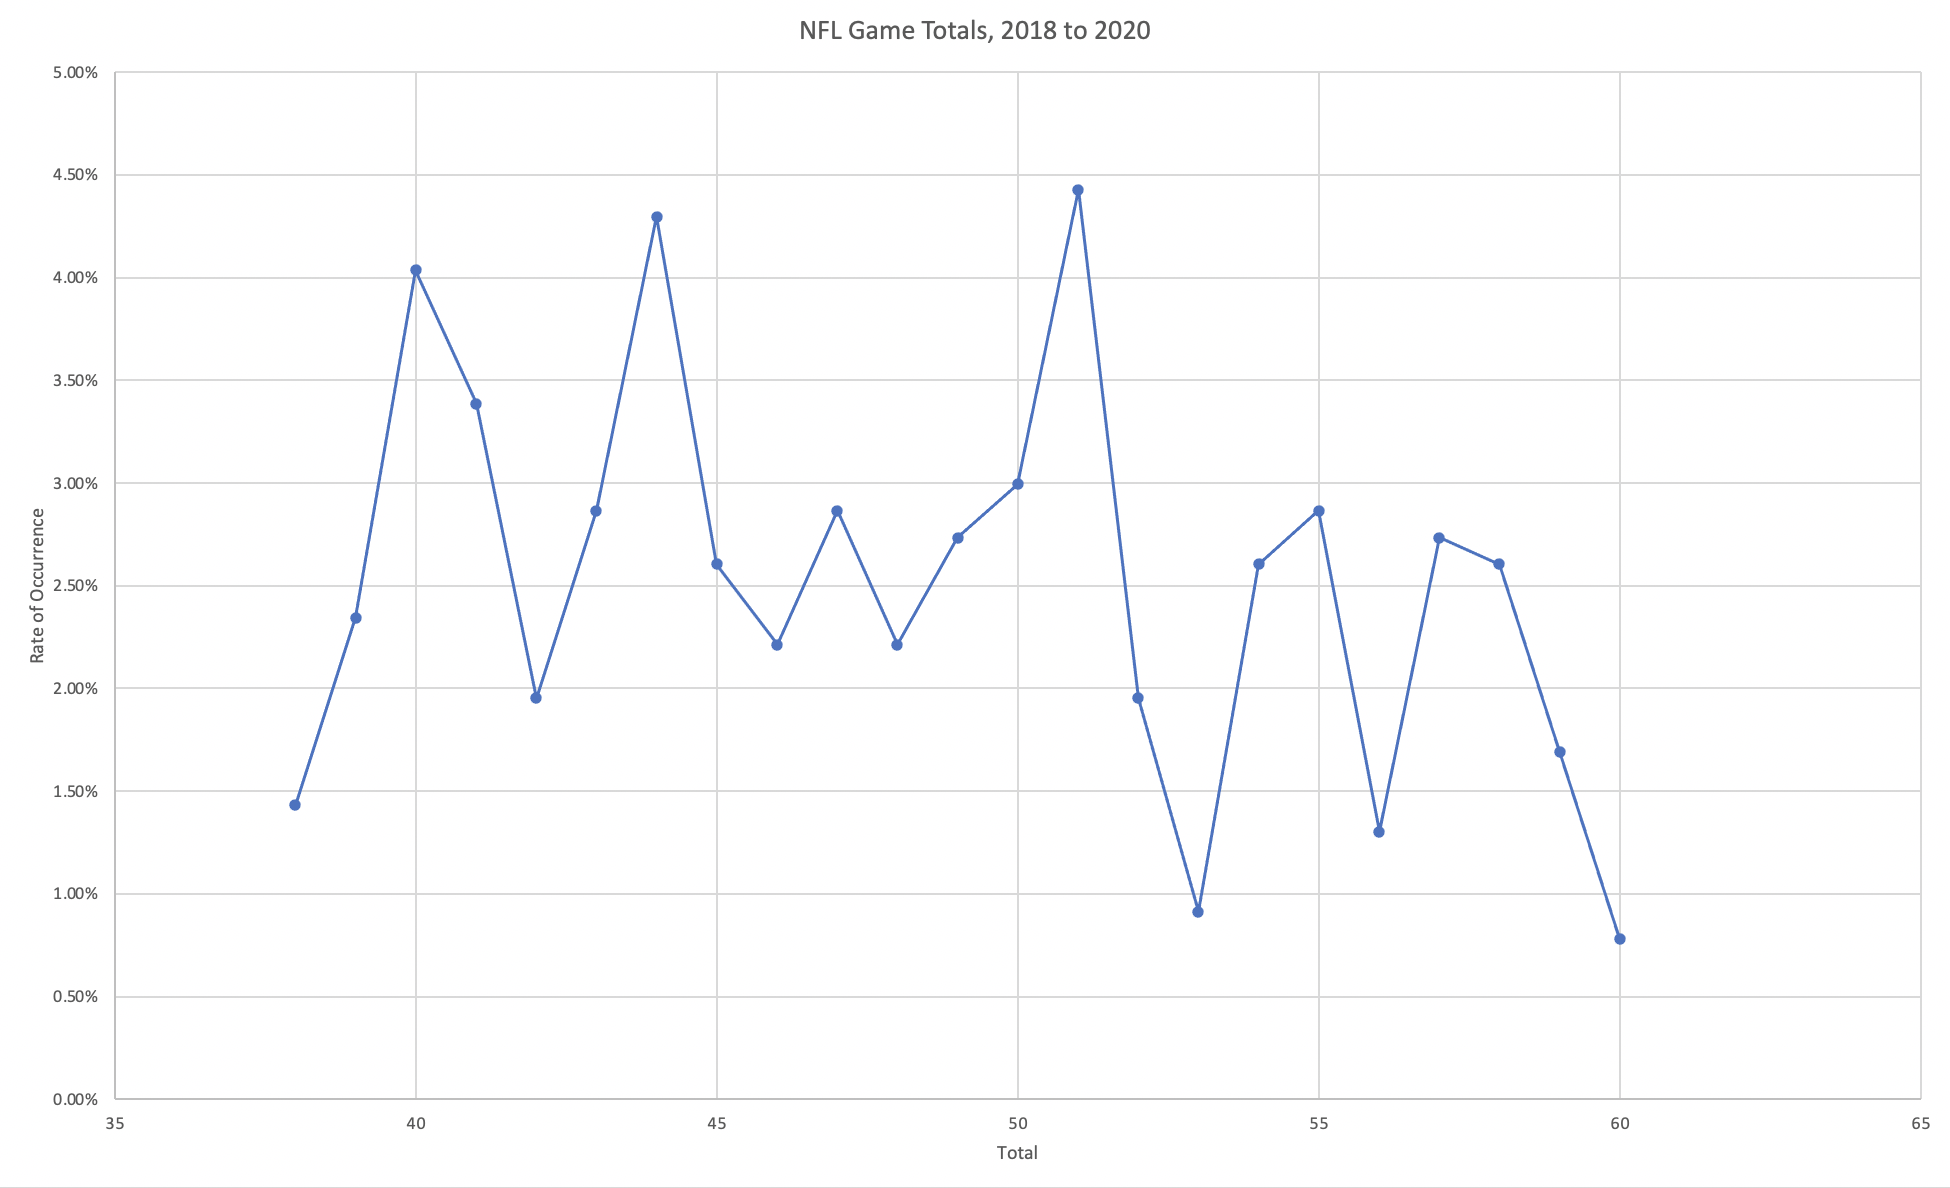
In this three-year span, the most common total was 51 with additional peaks at 44 and 40. No numbers between 44 and 51 occurred at higher than a 3.0% rate, though 45 and 49 did so in 2020 alone.
Again, key numbers for totals aren't as much of a focal point because the range of possible outcomes is so much larger. But we should be digging for any edges we can get, and knowing about the spikes at 40, 44, and 51 is helpful, and those were the top ones for just 2020, as well. We'll also want to keep an eye on 45, 49, and 54, all of which popped up at a higher rate in 2020 than they had previously.
Takeaways
The shift in scoring was obvious this year, and it led to a massive change in the totals market. But as we saw above, it also led to slight changes in key numbers that we should carry with us into 2021.
For spreads, three was still the most common number, though it did slip a bit in prominence. The risers were the numbers surrounding three along with seven and 14, reflecting the more aggressive mindset with two-point conversions and fourth-down decisions.
The scoring increase shifted everything up for totals and team totals. The key numbers for both were still in line with what you'd expect, but the emergence of numbers that pop up in higher-scoring games (31 and 34 for team totals along with 51 and 54 for game totals) should stick in our minds when we bet potential shootouts.
In all, we don't need to totally reset how we view key numbers for betting. The major pillars are still what they were previously. We just have to make slight alterations, especially when betting on aggressive teams or those that figure to light up the scoreboard.


