


Daily Fantasy NASCAR: Foxwoods Resort Casino 301 Track Preview


One of the unique challenges with daily fantasy NASCAR is that every track is different. Not only does this mean that certain drivers will perform better at one place than another, but each track will have different scoring tendencies than the previous one. That means we need to alter our strategies pretty drastically.
Each week here on numberFire, we're going to dig into the track that's hosting the upcoming weekend's race to see what all we need to know when we're setting our lineups. We'll have a separate piece that looks at drivers who have excelled there in the past; here, we just want to know about the track itself. Once qualifying has been completed, we'll also have a primer detailing which drivers fit this strategy and should be in your lineup for that week.
This week, the Monster Energy NASCAR Cup Series is heading to Loudon, New Hampshire, for the Foxwoods Resort Casino 301. What can we learn by looking at past races at the Magic Mile? Let's check it out.
Track Overview
After spending most of the past few months at bigger, faster tracks, the Cup series will slow things back down this weekend at New Hampshire. It's a flat, one-mile track, and it brings plenty of elements of short-track racing from a DFS perspective.
The biggest crossover between New Hampshire and a true short track is the number of laps available. Although the 301 laps they'll run this weekend falls short of places like Bristol, Martinsville, and Richmond, it's still a good chunk more than we've had recent weeks in places like Daytona and Sonoma. We've got 30.1 FanDuel points available for laps led, and that will factor heavily into our roster construction decisions.
If we look at the past 4 races at New Hampshire -- the 4 in which stage racing has occurred -- there have been 8 drivers who have led 95 or more laps, exactly 2 per race in that span. That means in each race, at least 2 drivers have gained 9.5 points for laps led on FanDuel. That makes a big difference.
Because New Hampshire isn't the widest track (making passing more difficult), most of those laps led come from drivers starting toward the front. The deepest a driver has started and gone on to lead at least 95 laps has been 8th, and 5 of the 8 drivers started within the first 3 positions. If you start up front and have a fast car, you can create plenty of upside via laps led.
Passing is possible from deeper in the pack, but you have to have a good car to pull it off. Last year's 2 races had 2 drivers -- Kyle Larson and Joey Logano -- start 39th and post big scores on FanDuel. But they're also the only drivers to start outside the top 30 and do so over the past couple of years.
This means that if a great car struggles in qualifying (or misses it all together) and starts in the back, they can be a great play for DFS. But you need to make sure their practice times and current form are good enough to ensure they'll be able to weave their way through traffic and finish in the top 10.
We'll get some help in deciding that via practice times. For New Hampshire's two races last year, the correlation between practice rankings and finishing positions was 0.679. That was 7th-highest of 23 tracks on the schedule. Practice times mean a lot, and plenty of drivers should log 10-lap averages to further assist us in our search for fast cars.
If you're looking for tracks similar to New Hampshire to see how drivers have run there this year, don't look at the length. That would lead you to Dover, and these two tracks could not be more different. Instead, you want to look at the banking.
New Hampshire is a flat track with just 12 degrees of banking in the corners. There are two other tracks -- Phoenix and Richmond -- where the series runs that have flat banking and are relatively short. The series has been to both tracks once this year, and those races will give you solid data about what to expect from individual drivers this weekend.
So, we know practice matters a bunch, and we can look to Phoenix and Richmond to decide who will do well. But how should we be constructing our rosters? Let's circle back to the discussion around laps led and place differential and look at historic scoring trends at the track.
Historic Scoring Trends
We know for sure that we'll need drivers starting at the front who can lead laps. But just how many of them should we get before focusing on place-differential points?
We'll get to that in a second. But first, here's a broad overview of the FanDuel points scored by starting position at the past four New Hampshire races.
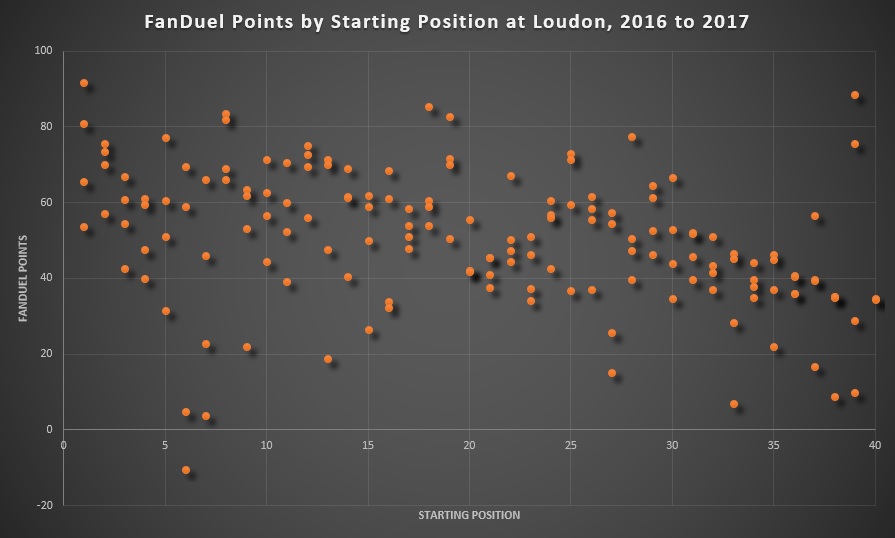
There are a couple of quick takeaways we can get here.
First, you can score a bunch of points from various spots in the field. It's just more common at the front.
Of the 12 drivers to score 75 FanDuel points in this span, 6 of them started in the top 10 (with 4 in the top 5), and only 3 came from outside the top 20. The Larson and Logano performances of last year happen, but it takes a very specific strength of car to achieve it.
Second, check out the lower left-hand corner of the graph. Normally, you'll see some dots in that range, and there are a few here. But it's not super common.
This seems to indicate that drivers who start at the front have lower levels of attrition than they have at other tracks. A reduced floor is one of the two big concerns with using drivers there (a capped ceiling if they can't lead laps is the other), and that isn't as frightening here as it may be elsewhere. Big-time drivers can still crash -- Kevin Harvick finished 36th after starting 6th last year -- but things are generally less volatile.
Finally, scoring here among drivers who don't lead a bunch of laps is fairly flat. You have the top-end scores, but after that, things are tightly grouped together for the most part.
This type of layout is more conducive to balanced rosters than others. Yes, we need to make sure we get those high-upside drivers, but overall, we can't be going full-on stars and scrubs at this track.
If you decide to pay for two high-priced drivers in one lineup, you likely need to skip over the middle tier entirely and scoop up the value drivers in the $8,500 to $7,000 range. Once you get below $7,000, that's where you start to find drivers who will be on the far right side of the graph above, and that's where the flat scoring output falls off the table.
If you do decide to go with a "punt" option below $7,000, you'll want them starting around 30th and to be capable of finishing in the top 15. Danica Patrick -- who would have been on the cheaper end of the scale had FanDuel salaries been around -- started 30th and finished 13th in last year's summer race, scoring 66.6 FanDuel points. We can accept that. Patrick scored 65.6 points in going from 29th to 14th in the 2016 summer race, and Ty Dillon scored 59.6 points by starting 25th and finishing 16th in the summer 2017 race. Using these types of drivers will put a lid on your roster's potential, though, so it's best to avoid it if at all possible.
This may paint a bit of a conflicting picture. On the one hand, we need laps led -- which tend to come from high-priced drivers -- but on the other, we need to try to be balanced. How can we properly juggle those two?
We can get a better idea of this by looking at how many drivers starting toward the front we should have on our rosters. Then, we can see just how many laps led we should expect a successful lineup to have.
Let's first check out what an "optimal" lineup would look like if we were to ignore salaries and just pick the five highest-scoring drivers for each race. Those are in the table below for the past four races. The "1st" column shows the starting position of the driver who scored the most points in that race.
| Race | 1st | 2nd | 3rd | 4th | 5th |
|---|---|---|---|---|---|
| 2017 Fall | 1 | 5 | 39 | 10 | 13 |
| 2017 Summer | 39 | 8 | 1 | 19 | 12 |
| 2016 Fall | 8 | 19 | 2 | 12 | 11 |
| 2016 Summer | 18 | 28 | 12 | 2 | 25 |
Sixteen of the 20 drivers in the optimal lineups started inside the top 20, meaning there were as many drivers who started on the front row (4) as there were who started outside the top 20. This furthers the discussion above about needing a specific kind of car to move through the pack.
The other big thing on that chart is that 3 of the 4 races had multiple drivers starting inside the top 10 crack the optimal lineup. The 2016 summer race had just one, but drivers starting sixth and eighth represented the seventh- and eighth-highest-scoring drivers in the race, respectively. You will generally need multiple guys starting at the front in your lineup.
This -- not surprisingly -- is because of the discussion around laps led. The chart below is the same thing as above, except it shows the number of laps led by that driver rather than their starting position.
| Race | 1st | 2nd | 3rd | 4th | 5th |
|---|---|---|---|---|---|
| 2017 Fall | 187 | 112 | 0 | 0 | 0 |
| 2017 Summer | 1 | 54 | 137 | 0 | 0 |
| 2016 Fall | 105 | 8 | 141 | 3 | 2 |
| 2016 Summer | 38 | 0 | 0 | 133 | 0 |
Every optimal lineup has had at least 2 drivers who led 38 laps. The 2016 summer race is a bit of an oddball here, as well, but that's partially because Martin Truex Jr. finished 16th after leading 123 laps, shoving him lower on the scoring totem pole. That can happen, so it's okay to have some lineups with just one dominator, but for the most part, we should be riding with two.
Because of this, when you're buildling lineups, you should start by trying to pinpoint which two drivers will be the duo running out front. These drivers should likely be starting within the top 10 positions, and the closer to the front they are, the better.
But after that, you'll want to dip down for place-differential points. Just not too far.
After drivers starting in the top five, the starting ranges with the highest average FanDuel scores at New Hampshire are those starting 11th through 20th. And anecdotally, this makes sense.
If a driver starts in this range, he or she likely has a respectable car. If that translates into a solid run on Sunday, they can convert that into a good finish for the finishing points and pick up a few place-differential points in the process. That's exactly what we want.
As such, this is the range where we should try to locate our mid-tier drivers. There will be some risk here because lower-cost drivers starting in this range could slide backward, but the scoring trends seem to indicate that we need to be willing to roll the dice a bit. A driver who starts 15th and finishes 11th scores more points on FanDuel than one who starts 26th and finishes 15th, so we must be willing to sacrifice a bit of safety if it gives us a better finishing slot.
If you can find a respectable (non-elite) car starting deeper in the field, just ask yourself what a realistic finishing position for them may be. If they can make a push for a top 10 despite the poor starting spot, then they are a great option. But New Hampshire makes that less likely than it would be elsewhere, so be sure to proceed with caution if this opportunity presents itself.
Finally, if you do need to punt with a driver priced below $7,000, you'll want them to start around 30th with the ability to post a top-15 finish. We should try to avoid this, but if we have a mix of high-priced drivers in both the front and the back of the starting order, then we may not have much of a choice.


