The Denver Broncos struggled on offense this season by just about every measure: the eye test, traditional stats, advanced stats.
And because their defense carried them to the Super Bowl, this underperforming offense will get a crack at a championship trophy.
And by "underperforming," I mean the worst offense to play in a Super Bowl game since and including 2000.
Now, before you rage-exit this tab or window because you're sitting there thinking, "Yeah, this offense is worse than Jake Delhomme's 2003 Panthers and Rex Grossman's 2006 Bears?" just stick with me.
The NFL has changed, and offenses have benefitted from myriad changes. On top of that, points scored and yards gained don't always paint a clear picture of how good an offense is.
But if we adjust for offensive success each year, adjust for schedule strength, and use our
In order to adjust for this, we need context for each Super Bowl offense. That will come from the season during which they played. We'll figure out the standard deviation from the Adjusted NEP scores in that given year and see how far teams performed above or below the mean.
For Denver, it's not pretty.
Denver's offense was a big step behind the rest of the NFL this year, making it the weakest offense relative to other teams that same season to appear in a Super Bowl in the NEP era.
It's not particularly close.
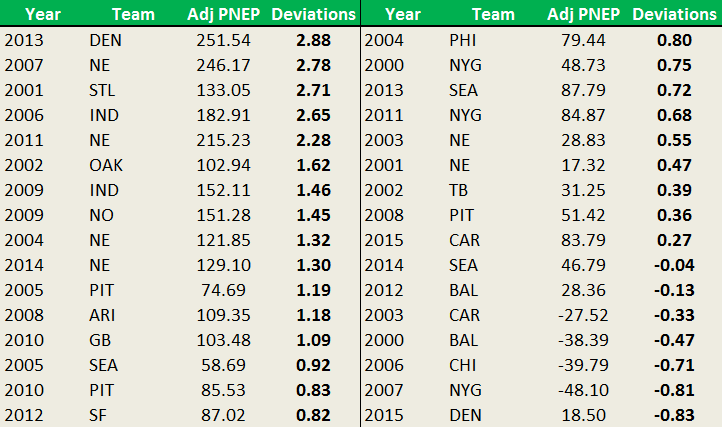
In addition, their Adjusted Passing NEP of 18.50 ranked 27th among the 32 Super Bowl squads. Though five teams were worse -- 2007 Giants (-48.10), 2006 Bears (-39.79), 2000 Ravens (-38.39), 2003 Panthers (-27.52), and 2001 Patriots (17.32) -- Denver's mark strayed farther from the mean (67.58) of all 32 squads. (You can check out the chart here.)
Two quirky additions to that: Denver's 2013 passing offense was 2.88 standard deviations above the mean, the best mark of all Super Bowl squads, and their current offense was 0.88 below the mean. Also, Carolina's passing offense finished just 0.27 standard deviations above the mean this season, the 25th-best mark of the 32 squads.
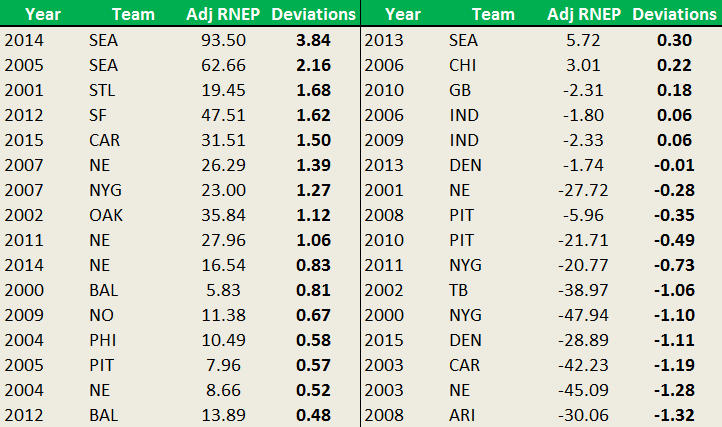
As for the rushing offense, Denver's Adjusted Rushing NEP (-28.89) ranked 27th again, 1.11 standard deviations below the mean. They avoided last place by three spots, ranking 29th in terms of distance from the mean. Only the 2003 Panthers (1.19 standard deviations from the mean), 2003 Patriots (1.28), and 2008 Cardinals (1.32) were worse. (Click here for the full chart.)
The 2015 Panthers' Adjusted Rushing NEP of 31.51 is fifth best in the group and their mark of 1.50 standard deviations above the mean is also fifth best.
The overall difference between Carolina's Adjusted NEP of 127.35 and Denver's -15.48 (142.83) makes it the fifth-biggest gap between NEP scores in these 16 Super Bowl matchups.
Of course, no matchups compare to the discrepancy between the 2007 Patriots' 276.24 Adjusted NEP and the Giants' -14.35 (a difference of 290.59).
And we all know how that one turned out.