


What Historical Rookie Running Back Production Means for This Year's Draft Class


Todd Gurley. Melvin Gordon. Jay Ajayi. Ameer Abdullah. Duke Johnson. Tevin Coleman.
Take any one of these names and I can give you a plethora of reasons why each one deserves to be taken at or near the top of the draft. And with so many game-breaking talents available in this year's draft, the expectations for the running backs ranked at the top of the list are sky high.
But what can we truly expect from these young tailbacks their first season on the job?
Using data from the past 15 seasons (2000-2014) for the top five running back prospects selected in each draft, I sought to answer three key questions.
1. What did it cost these teams in terms of overall pick?
2. What workload did these top-five rookie running backs receive in their first year?
3. What was the overall production for these top-five rookie running backs?
What follows are the findings of this study, with some particularly insightful and perhaps unexpected results.
1. There's No Such Thing as a Free Lunch: The Cost of a Top-Five Rookie Running Back
First things first: one does not simply attain a top five-ranked rookie running back without using a fairly high draft pick.
Historically, teams in need of this position have had to use a pick well within the first two rounds to nail down a top-five tailback, with the first overall running back on average costing teams the 15th overall selection, and the fifth back selected being taken with the 56th pick.
| RB Selection | 1st | 2nd | 3rd | 4th | 5th |
|---|---|---|---|---|---|
| Avg Pick | 15.4 | 24.1 | 36.4 | 47.7 | 55.7 |
Even with the recent trend the last two drafts of no running backs being selected on day one, in 2013 all five of the top backs selected were still off the boards by the end of the second round.
In fact, in only three seasons has a top-five back been selected in the third round or later (Musa Smith, Chris Brown, and Justin Fargas in 2003, Shonn Greene in 2009, and Charles Sims and Tre Mason in 2014).
And with a number of potentially game-changing backs available in this year's draft -- including Todd Gurley, Melvin Gordon, and Jay Ajayi -- coupled with a number of teams in dire need at this position -- particularly San Diego and Dallas with the 17th and 27th overall picks, respectively -- the historical trend for running backs to be taken early and often in the draft has a high likelihood of repeating itself this year.
2. You Have to Spend Money to Make Money: Top-Five Rookie Workload
Typically, when a team uses a high draft pick on a rookie running back it means one of two things. Either they've lost their lead running back from the season before to free agency, trade, injury, or retirement, or they have an ineffective veteran back they're trying to replace.
Either way, its more than likely that these teams are relying on their young ball carriers to provide instant value to their ground games.
And if it's production these teams are looking for out of their rookies, there's no better way to ensure they squeeze out as much value as possible from these athletes than by feeding them a heavy dose of touches.
But when we look at the number of touches the top five running backs taken in the draft received in their first year on the job, we find that, on average, these backs accrued a decent, but un-amazing workload.
| Avg Tot Touches | Avg Rushes | Avg Tgts | Avg Recs |
|---|---|---|---|
| 154.7 | 135.1 | 27.1 | 19.6 |
Indeed, these running backs amassed just 155 total touches on 135 carries and 20 receptions their rookie season.
The particularly low reception rates for these backs is a clear reminder of their inexperience in the pro game as a whole. Due to the difficulties most running backs have in adapting to the complex pass blocking schemes of the NFL, few backs see consistent third down work their first year on duty. Indeed, only four of the 75 eligible rookie tailbacks of the past 15 years -- LaDainian Tomlinson, Reggie Bush, Jahvid Best, and Giovani Bernard -- caught more than 50 passes in their rookie season.
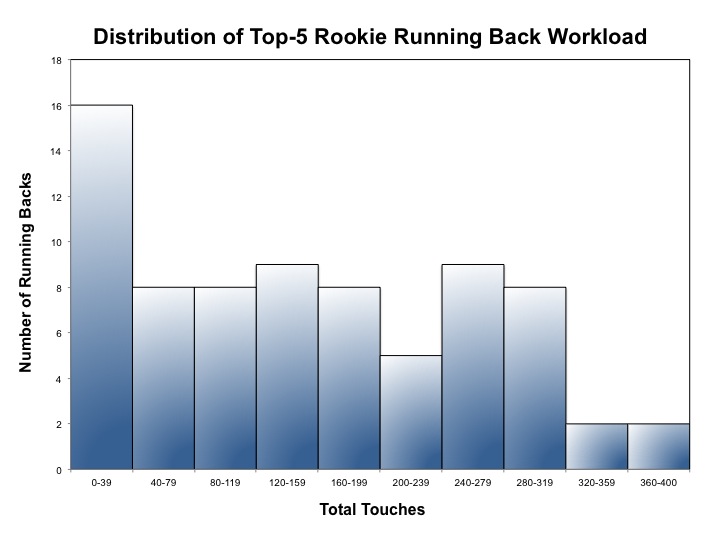
Moreover, when we look at the distribution of these players in terms of workload, we see that only a small subset of players managed to fall into the upper tiers of our scale. Only 21 out of 75 backs in our study (28%) were able to reach 240 or greater touches (or 15 touches per game over a 16-game span) during their first year in the NFL.
On closer examination we also see that the probability of receiving this high workload is not distributed evenly amongst the first five running backs selected in each draft. Instead, there is a direct correlation between draft position and total touches, with backs selected earlier in the draft receiving on average the higher workloads.
| RB Selection | 1st | 2nd | 3rd | 4th | 5th |
|---|---|---|---|---|---|
| Avg Tot Touches | 224.7 | 155.6 | 140.9 | 156.3 | 130.3 |
The top back selected in each season has averaged nearly 225 total touches their rookie season, compared to just 155.6, 140.9, and 156.3 touches for the second, third, and fourth backs selected, respectively.
We also find that being selected as the fifth back off the board is particularly detrimental to first year workload, with these backs on average receiving just 130.3 total touches their rookie year.

Consistent with these detriments of being the fifth back off the board, a disproportionate number of these players from this group (9 out of 15 to be exact) actually received fewer than 100 touches their rookie year. Consequently, from this subset of tailbacks only two, Chris Johnson and Julius Jones, ever received more than 200 total touches their first season in the league.
Contrast these figures to that for the first running backs selected in the draft, where 10 out of the 15 athletes in this group have each received 200 or more total touches their inaugural year.
While potentially surprising at first glance, this discrepancy also makes logical sense. Teams willing to spend the draft capital to take the top running back off the board are also the ones most in need of said rookie back's contributions to the offense, whereas teams that can wait for the fifth best back can likely afford to ease that player into the rotation.
From this analysis it becomes clear that being selected as one of the first five running backs off the board does not automatically entitle these tailbacks to guaranteed playing time. They still must compete with the other veterans on the roster for reps in the backfield and must earn the trust of their coaches and teammates.
But we also see that if you're looking for someone to bet on to see significant touches, the odds heavily favor the first back selected in the draft.
3. Return on Investment: Top-Five Rookie Productivity
From the section above we see that the top five rookie running backs selected in the draft received a surprisingly moderate workload. Beyond this, the workload distribution followed a direct correlation with draft position with players selected earlier in the draft receiving heavier workloads on average than those selected later.
So what do these rookie tailbacks do with these looks in the backfield?
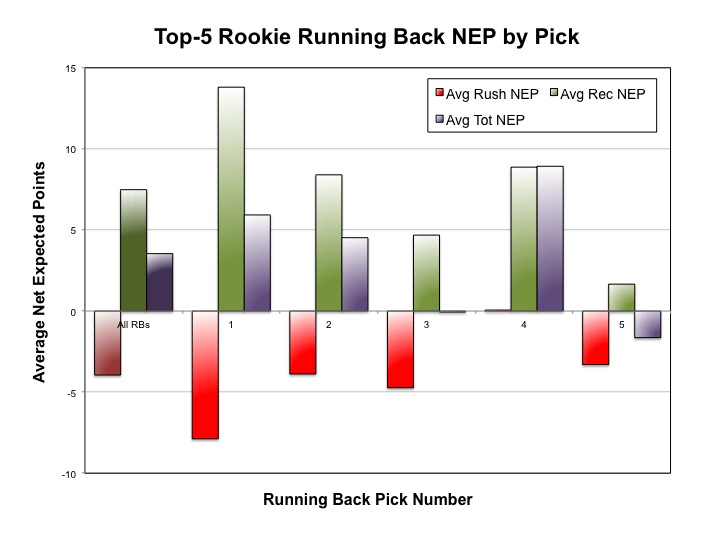
In terms of contribution to team success as measured by our rushing and receiving Net Expected Points (NEP) metrics we see that these rookie backs were relatively ineffective. NEP is a measure of a player's contributions above or below expectation for any given situation.
On average, these backs produced a Rushing NEP of -3.94 and a Reception NEP of 7.48. This is in contrast to the top-12 running backs from the 2014 season who averaged a Rushing NEP of 11.5 and Reception NEP of 27.5. This discrepancy is in part due to the modest workloads these backs received, as well as the inexperience of these players in the pro game. Also, rushing is inefficient by nature, and placing rookies into this role can compound the problem.
What is particularly interesting is that while Reception NEP correlates with draft position -- with the first running back off the board averaging a greater Reception NEP (13.8) than the fifth back off the board (1.66) -- the first tailback selected also averages the worst Rushing NEP (-7.87) of all these players.
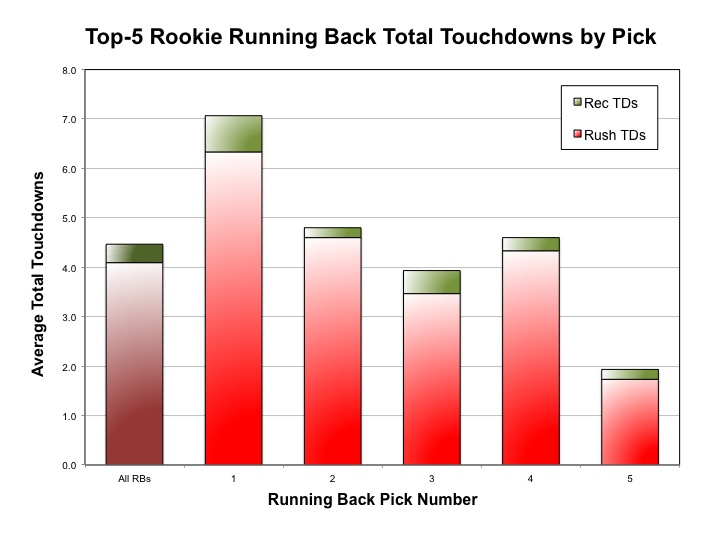
When looking at yardage and touchdown totals, we find that the top five backs as a whole averaged 534.2 yards on the ground and 152.5 yards in the air to go along with 4.5 total touchdowns per season.
But consistent with what we found earlier in terms of the relationship between draft position and workload, the distribution of yards and touchdowns were also distributed in direct relation to draft position.

In line with the averages for the top five running backs as a whole, the second, third, and fourth running backs selected in the draft also averaged between 560 and 715 total yards and between 3.9 and 4.8 total touchdowns in their rookie seasons.
However, we see a large discrepancy when we look at the ends of the draft. The first tailback off the board averaged 1,105 yards and 7.1 touchdowns in their first year in the league compared to just 408 yards and 1.9 touchdowns for the fifth back chosen.
We see from this analysis that as one might expect, production for the top five rookie backs, just like workload, are also not guaranteed. We find that the outlook is particularly bleak for the fifth backs selected in the draft with these players on average mustering just 400 yards and 2 total touchdowns in their first year.
However, not all backs selected in the draft are doomed to below-average production. Commensurate with perceived skill set and ability, the running backs selected as the top back of the group are afforded much greater opportunity and in turn churn out far more yards and touchdowns compared to even the second back selected in the draft.
Outlook for the Class of 2015
So what does this all mean for the upcoming running back draft class of 2015?
Some argue that regardless of where the top five backs go in the draft, these players possess such immense talent and potential that the expectation is for them to produce significant numbers their first year in the league regardless of what position they land.
But based on our analysis, are these expectations grounded in reality?
If we take a look at the similarly talented running back draft class of 2000, we see that despite this group of players having three Pro Bowlers selected in the top five of the position, the distribution of touches and production followed the same trends we discovered in our analysis above.
While the first back selected in the draft, Jamal Lewis, amassed 1,660 total yards and 6 touchdowns in his first season, the fourth back selected, fellow All-Pro Shaun Alexander, collected just 354 total yards and 2 touchdowns that same year.
| RB Pos | Rd | Pick | Team | Player | Tot Touches | Tot Yds | Tot TDs | Tot NEP |
|---|---|---|---|---|---|---|---|---|
| 1st | 1 | 5 | Ravens | Jamal Lewis†| 336 | 1660 | 6 | 20.4 |
| 2nd | 1 | 7 | Cardinals | Thomas Jones†| 144 | 581 | 2 | -23.6 |
| 3rd | 1 | 11 | Giants | Ron Dayne | 231 | 781 | 5 | -33.7 |
| 4th | 1 | 19 | Seahawks | Shaun Alexander†| 69 | 354 | 2 | 1.4 |
| 5th | 1 | 31 | Rams | Trung Canidate | 4 | 10 | 0 | -0.9 |
†= Pro Bowler
Therefore, with all eyes on the NFL Draft coming up at the end of this month, it's clear that there is much at stake for the members of the 2015 running back class. Team needs will impact when these players are selected, and the more draft capital spent on a player, the more likely it is that he'll be relied upon in his first season.
Therefore, when these players are selected in the draft could end up mattering almost as much as who selects them, as these factors will likely have a strong influence on the production and workload these backs will receive their rookie season.


