


Daily Fantasy Football: Analyzing Trends in FanDuel's 2021 Perfect Lineups


The 2021 daily fantasy football season was like watching a sex scene alongside your parents: uncomfortable.
In that situation, what are you going to do? Turn the movie off... and then make small talk about it? Absolutely not. You white-knuckle the arm rests, stare straight forward, and never bring it up again.
There was a whole lotta white-knuckling this fall. My typical DFS process revolves around stacking games with high totals and tight spreads. I'm trying to pinpoint shootouts where both sides are putting up points and pushing for all four quarters.
That kind of game was rare in 2021. Totals sagged with a dip in scoring, and most of the palatable offenses were often in less competitive games. I couldn't lean on my baseline approach, and it made things super uncomfortable.
But because we get only 18 main slates per year, I couldn't skip ahead. I was stuck in an undesirable spot.
Unlike the parents-in-the-bone-zone situation, I can't just pretend this never happened. We're going to have slates in the future with low projected scores and unappealing tight games. If I want to prepare for those situations, I've got to suck it up, dig into the data, and figure out an optimal approach.
That's where perfect lineups can help. A perfect lineup is the best lineup you could have filled out while staying under the FanDuel salary cap and adhering to roster limits. Not only can it give us a template of success, but it shows in which conditions upside is most likely. The shootout blueprint will always lend itself to upside, but analyzing the 2021 data will help us expand our checklist.
Today, we're going to go back through the 18 perfect lineups from this past NFL season, see what conditions bred upside, and outline how that applies to our lineup-building process going forward. It can act as our IMDb Parental Guide to avoid distressing situations in the future.
Game Stacking
The lopsided spreads had their biggest impact when it came to game-stacking, so let's start there.
Game-stacking is where you have exposure to players on both sides of a single game. That way, if the game is high-scoring and competitive, you benefit via upside for everyone involved.
It's just tougher to justify game stacks when the score is more lopsided as it implies one team will struggle to keep up. So, when things got tilted this year, it made a key tenant of my process less viable.
Game stacks were still prevalent in perfect lineups, though, on par with levels we saw in previous years.
In total, 62 of 162 (38.3%) players or defenses in perfect lineups were paired with at least one player on the opposing team. If you lop off the defenses and special teams, that rate rises to 41.0%, down just a hair from last year.
| Year | Percentage of Non-DSTs as Part of Game Stack |
|---|---|
| 2021 | 41.0% |
| 2020 | 41.9% |
| 2019 | 36.0% |
| 2018 | 34.6% |
Perfect lineups are not the best format for encapsulating the value of game stacks (or single-team stacks) as only the best-of-the-best at each position make the cut. You can be a worthwhile play without making a perfect lineup. But even with that caveat, seeing two-fifths of all players be part of a game stack is huge and means we should continue to emphasize that even when our process gets toyed with.
What did change was the situations conducive to game stacks. In last year's perfect lineups, only 1 of 25 game stacks came from a game with a double-digit spread. That increased to 7 of 25 this year (28.0%) even though only 17.6% of all games had a spread that large.
| Spread | Perfect Lineup Game Stacks | All Games |
|---|---|---|
| Less Than 5 Points | 48.0% | 50.0% |
| 5 to 9.5 Points | 24.0% | 32.4% |
| 10-Plus Points | 28.0% | 17.6% |
The 2020 season also had half of all games with a spread of less than five points, but 64.0% of the game stacks came from that sample versus 48.0% this year. Tight games just weren't as conducive to game stacks this year, showing the data aligns with how it felt.
There are two things I want to note here, though. First, we are dealing with a small sample. It's just 25 game stacks from one year. That's too little to definitively state anything.
Second, this goes counter to what you'd expect anecdotally. Both sides need to score points for a game stack to work, and that's a tougher sell when one side is heavily favored. So this goes a bit against logic.
That's why I'm not going to overreact to this one year of data. Instead, I'm going to make a slight tweak to my process. When the spreads got large this year, I often reduced the degree to which I game-stacked in individual lineups, skewing more toward single-team stacks and one-offs. The data shows I don't need to do that. I'm still going to prefer game stacks in close, high-scoring games, but if those aren't available, I should still consider game stacks in the less process-oriented games.
The other thing that stood out in the data was how common it was to stack a running back with an opposing wide receiver. This combination appeared nine times, the most of any pairing on the board.

Part of this is because those are just the positions you roster most in a single lineup. But they also had the highest rates of players in perfect lineups being part of a game stack for any position (43.2% of backs, 41.9% of receivers).
This is easy to explain anecdotally, as well. When one team gets ahead, they're able to pump more volume to the running back. The other team, meanwhile, must throw to catch up, increasing potential volume for the pass-catchers. Overall, 27.3% of all perfect backs were paired with at least one receiver or tight end on the other team.
Given how prevalent game stacks were once again, even in a format that doesn't properly illustrate their value, we should continue to keep them a central focus of our process. Each time we put a skill player in our lineup, we should at least ask whether any players on the other side would also benefit from a potential shootout. Most often, this will still be in games with high totals and tight spreads, but 2021 did show we can at least relax those standards a bit.
Single-Team Stacks
The game-stacking data showed how inter-connected backs and receivers can be. The single-team stacks show that this thought process applies to quarterbacks and tight ends, too.
Here, we'll define a single-team stack as any combination of teammates who made an individual perfect lineup. Often, stacking will refer to more than two players on one team, but again, perfect lineups aren't the best method for showing the value of stacks. We'll keep it to a minimum of two here.
Even with this not being the ideal format, we still saw 23 single-team stacks across 18 perfect lineups, an average of 1.3 per week. So it's not just simply pairing a quarterback with a pass-catcher. A bunch of other combinations pop up in perfects.
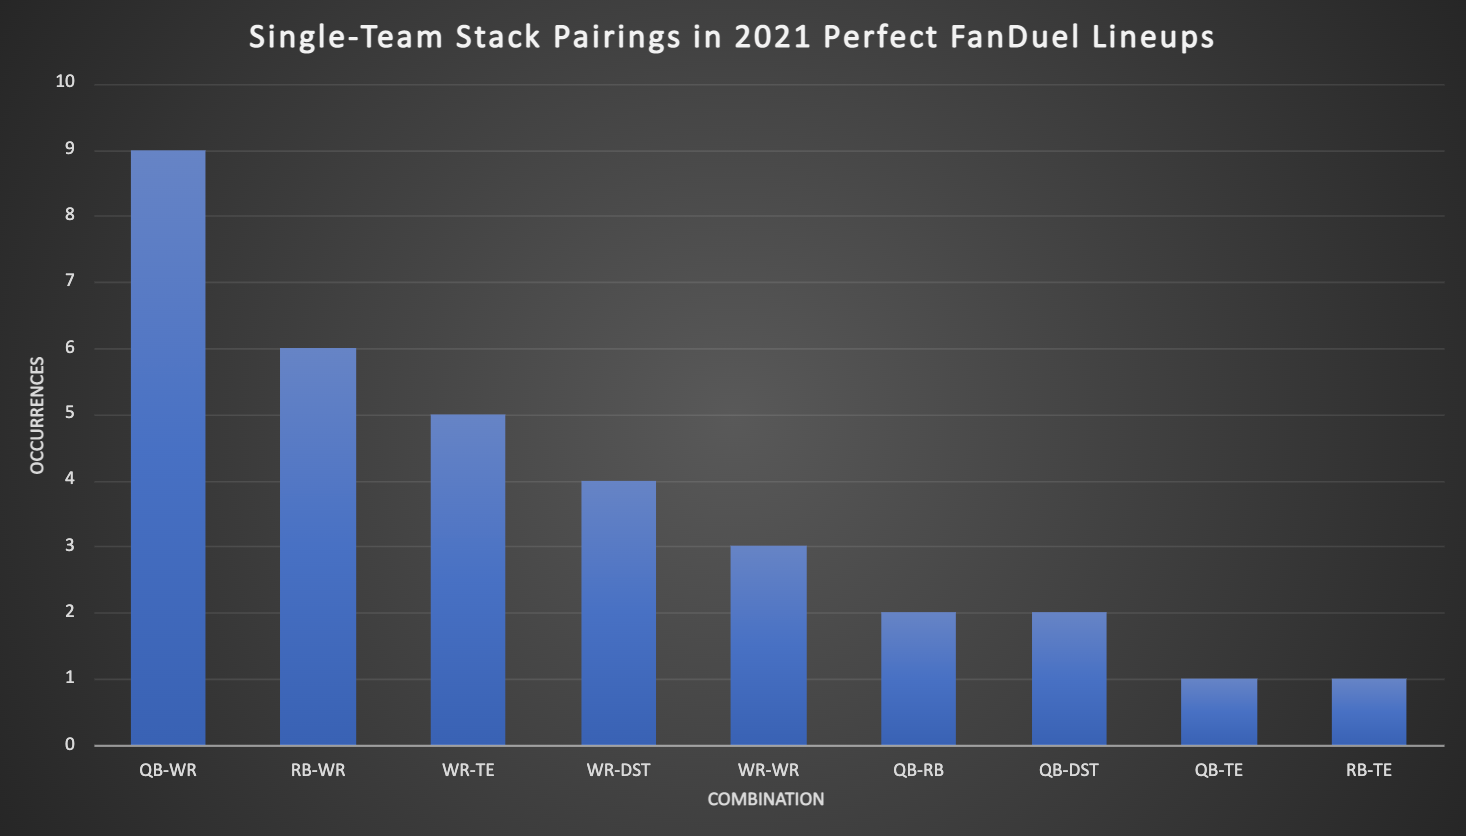
The prevalence of the running back-receiver stacks is noteworthy and should increase our willingness to pair teammates at those positions together. You may not get the double-dip from a passing touchdown paired with a receiving touchdown, but a team putting up points benefits everybody.
Quarterbacks were involved in 10 of the 23 stacks, and tight ends were involved in 6. Once you adjust for the lower roster slots for the two positions, that is noteworthy.
If we combine single-team and game stacks, 66.7% of quarterbacks in perfect lineups were paired with somebody else from that game. The same was true for 65.0% of tight ends compared to 59.7% of receivers and 47.7% of running backs. You just didn't get many standalone plays at the three positions tied to the passing game.
This will be a factor in how I view tight ends, specifically, going forward. If I'm using a quarterback or a receiver on a team, I'm giving an endorsement of that passing offense and thinking they'll be effective. That could very well translate to hoisting their tight end, as well. Given how much of a crapshoot tight end can be, it's not a bad idea to consider lumping your tight end in with other pieces in that game's passing offense, whether on that player's team or the opposing side.
The other takeaway from the single-team stacks is that it was still wise to target higher-scoring games, even if they weren't as prevalent. More than one-third of the single-team stacks came from games with a total of 50 or higher even though only 19.5% of all games fell in that bucket.
| Total | Perfect Stacks | Overall |
|---|---|---|
| 50 or Higher | 34.8% | 19.5% |
| 46 to 49.5 | 21.7% | 31.3% |
| 42 to 45.5 | 30.4% | 35.7% |
| Lower than 42 | 8.7% | 13.6% |
Five of those eight games with higher totals did have tight spreads, too, so vive la resistance. Even as the NFL moves against me, those high-scoring, tight games still matter when they do pop up.
Overall, based on looking at these stacks, it's clear to me that we need to be hunting for connected players within our lineups. This is not a groundbreaking notion by any means; you're already doing this within your lineup building process. It's more to say that we should shift the question of, "Should I pair Player X with more players in this game?" to the front of our process versus making it a cherry on top at the end.
The Flex Position
In last year's look at perfect lineups, we saw a shift toward wide receivers in the flex. Running backs had occupied the flex 61.8% of the time in perfect lineups in 2018 and 2019. That fell to 47.1% last year with receivers being equal and tight ends claiming the belt once. This year was a continuation of that.
| Position | Times Flexed in Perfect Lineup |
|---|---|
| Running Back | 8 |
| Wide Receiver | 8 |
| Tight End | 2 |
For bookkeeping purposes, Cordarrelle Patterson was labeled as a running back the two weeks he made a perfect lineup with dual eligibility, given that's the position he played. Without him, this would have skewed even more toward the receivers.
Personally, this isn't enough to get me to shift away from running backs in the flex for most of my full-slate lineups. Running backs on at least 1% of FanDuel Sunday Million rosters were more likely to return two points, three points, and five points per $1,000 of salary than receivers, and their workload is more predictable. That final aspect isn't baked into perfect lineups because they're purely results-based. So, I'm not altering my approach based on this data, but I'm fine being more open to a receiver in the flex on weeks where the running back pool is thinner, something that happened often this year.
Quarterbacks
High totals were still a key when identifying stacks. It's no surprise that thought directly translated over to quarterback.
| Category | Average Perfect QB |
|---|---|
| Salary | $7,811 |
| Passing Yards | 323.2 |
| Passing TDs | 3.1 |
| Rushing Yards | 35.0 |
| Rushing TDs | 0.8 |
| FanDuel Points | 32.9 |
| Roster Rate | 7.3% |
| Spread | -2.3 |
| Total | 48.1 |
| Wind | 6.2 |
| Home | 61.1% |
The 48.1-point total is almost two points higher than the league-wide average last year (46.3). It got there because perfect quarterbacks both were often in high-total games and rarely in low-total ones relative to the league as a whole.
| Total | Perfect QBs | Overall |
|---|---|---|
| 50 or Higher | 38.9% | 19.5% |
| 46 to 49.5 | 27.8% | 31.3% |
| 42 to 45.5 | 27.8% | 35.7% |
| Lower than 42 | 5.6% | 13.6% |
Even if totals do stick at 2021 levels, we should still be inclined to prioritize quarterbacks in games with higher marks.
One of the key angles we discussed last year was targeting quarterbacks on teams that were slight underdogs. The public rarely rosters those players, but they were in perfect lineups decently often. That approach paid handsomely in 2021.
| Spread | Perfect QBs | Overall |
|---|---|---|
| Favored by 10 or More | 11.1% | 8.8% |
| Favored by 5 to 9.5 | 27.8% | 16.2% |
| Favored by Less Than 5 | 22.2% | 25.0% |
| Underdogs by Less Than 5 | 33.3% | 25.0% |
| Underdogs by 5 or More | 5.6% | 25.0% |
You don't want to go chasing massive underdogs as those teams aren't expected to put up big point totals. But if they're just a slight dog, business can pick up in a hurry. Only two quarterbacks were double-digit favorites versus six who were underdogs of four points or less. Score another one for the tight-game theory.
In other words, quarterback fits what you might think logically: you want guys in potential shootouts who either are slight underdogs or who have big implied totals of their own. Thirteen of 18 perfect-lineup quarterbacks had an implied total of 24 or higher, and 4 of the 5 exceptions were slight underdogs. It's an easy checklist to follow when hunting for upside.
The final piece of perfect quarterbacks worth noting was the way scoring shifted last year. The average point totals were down (32.9 FanDuel points versus 34.2 last year), but rushing production actually increased. That means the percentage of FanDuel points that come from rushing production shot up significantly.
| Perfect QBs | Passing Yards | Passing TDs | Rushing Yards | Rushing TDs | FanDuel Points |
|---|---|---|---|---|---|
| 2020 | 365.7 | 3.2 | 26.4 | 0.6 | 34.2 |
| 2021 | 323.2 | 3.1 | 35.0 | 0.8 | 32.9 |
Games with high totals often get there via efficient quarterbacks with heavy projected passing output. As totals decrease, it makes sense that we might want to skew more toward guys who can make magic with their legs. Only five of the quarterbacks in perfect lineups had less than 40 rushing yards and no rushing touchdowns, and those guys averaged 384.5 passing yards and 3.8 passing touchdowns. If fewer players can light it up via the air, it's logical that we should put a slightly heavier emphasis on rushing, the other step-ladder to a ceiling.
All together, quarterback largely made sense in 2021, even with scoring down. We still wanted higher-than-average totals, tight games did give players a boost, and rushing production was used to replace any losses via the air. To me, that means we can avoid a total reset at the position and keep our baseline process heading into 2022.
Running Backs
While quarterbacks shifted toward more production on the ground, running backs did the opposite. An emphasis on passing-game work became even more important last year.
| Category | Average |
|---|---|
| Salary | $6,593 |
| Rushing Yards | 98.9 |
| Rushing TDs | 1.5 |
| Receptions | 3.9 |
| Receiving Yards | 36.3 |
| Receiving TDs | 0.4 |
| FanDuel Points | 26.8 |
| Roster Rate | 10.5% |
| Spread | -1.9 |
| Total | 46.2 |
| Wind | 4.9 |
| Home | 56.8% |
Those 36.3 receiving yards per game was an increase of 3.9 from last year. That's even with overall scoring among perfect backs down 2.6 points.
| Perfect RBs | Rush Yards | Rush TDs | Recs | Rec Yards | Rec TDs | FD Points |
|---|---|---|---|---|---|---|
| 2020 | 109.2 | 1.9 | 4.2 | 32.4 | 0.3 | 29.4 |
| 2021 | 98.9 | 1.5 | 3.9 | 36.3 | 0.4 | 26.8 |
Part of this could be just due to variance. Guys who typically light it up on the ground like Derrick Henry and Nick Chubb missed time or played in dysfunctional offenses, so it makes sense that things would shift. But an emphasis on pass-catching on FanDuel has been present for years now.
It's true that FanDuel awards just a half-point per reception, which is less than you'd get on other daily fantasy sites. Despite this, we've seen previously that a target -- not a reception; a target -- is worth twice as many FanDuel points on average as a carry. Not only might you get that half-point for a reception, but it's another avenue for racking up yards and, potentially, touchdowns. You'll often hear the thought that a rush-only back is better suited for a site like FanDuel. It's true that they are better-suited than they would be elsewhere; that does not mean they are well-suited.
Of the 44 running backs in perfect lineups last year, more than half had four-plus receptions.
| Receptions | Perfect RBs |
|---|---|
| 0 or 1 | 10 |
| 2 or 3 | 10 |
| 4 or 5 | 11 |
| 6-Plus | 13 |
This is in a year where pass-catching machine Christian McCaffrey missed almost the entire season. Passing-game work is still a massive factor, even on a half-PPR site.
One aid here is thinking about production in terms of yards from scrimmage rather than rushing yardage. This way, you're getting a more full scope of what it took to make a perfect lineup.
Last year, the 44 perfect running backs averaged 135.2 yards from scrimmage. Only 4 of them had less than 100, and all 4 of those had at least 4 receptions, 40 receiving yards, and a receiving touchdown. Basically, you get more of a cushion for leeway if you're adding the gimme half-PPR points.
So, if you want to roster a back who doesn't get a lot of production through the air, you have to ask yourself if that back has the ability to get you 135 yards and at least 1 touchdown. That's a path to almost 20 FanDuel points without getting assistance via receptions. You'll be able to say "yes" on some guys, and they're worth rostering. You just want to be picky as they have fewer paths to blowing up.
The other thing that stood out at running back was how many value guys came through. Only 19 of 44 perfect running backs had a salary of $7,000 or higher, and 15 of them checked in below $6,000. This, again, is in part due to superstars missing time, but this is also a position where guys projected to get good volume at a low salary are massively valuable.
With these value backs, we can be a bit more lenient on their roles as rushers. But they were even more dependent on passing-game usage than the group as a whole.
| Salary | Rush Yards | Rush TDs | Recs | Rec Yards | Rec TDs | FD Points |
|---|---|---|---|---|---|---|
| $7,000 or Higher | 110.8 | 1.7 | 3.9 | 32.9 | 0.4 | 28.8 |
| Lower Than $7,000 | 89.9 | 1.4 | 3.9 | 38.8 | 0.3 | 25.3 |
This is something we'll circle back to when we analyze the hit rates of heavily rostered backs in the FanDuel Sunday Million. In general, though, the data says we can have confidence in low-salaried backs as long as we believe they'll get volume, especially through the air.
Wide Receiver
It should come as no surprise that the takeaways at receiver overlap with those at quarterback. Even with totals down, you want to target players in games with more scoring than the league-wide average.
| Category | Average |
|---|---|
| Salary | $6,746 |
| Receptions | 7.5 |
| Receiving Yards | 123.9 |
| Receiving TDs | 1.6 |
| FanDuel Points | 26.6 |
| Roster Rate | 10.3% |
| Spread | -2.0 |
| Total | 47.8 |
| Wind | 5.4 |
| Home | 53.2% |
Again, the league-average total this year was 46.3 points. Both quarterbacks and wide receivers in perfect lineups exceeded that by at least 1.5 points.
As with quarterback, this split was due to both an overabundance of high-total games and a scarcity of those with lesser totals.
| Total | Perfect WRs | Overall |
|---|---|---|
| 50 or Higher | 27.4% | 19.5% |
| 46 to 49.5 | 38.7% | 31.3% |
| 42 to 45.5 | 24.2% | 35.7% |
| Lower than 42 | 9.7% | 13.6% |
To me, the takeaways from this should be pretty obvious. Let's pretend that totals continue around 2021 levels, lower than they were in 2020. Even at a reduced baseline, there will still be games that pop with higher projections relative to that baseline. Within those games, we should give long thought to passing-game pieces as they have been the breeding grounds of upside regardless of the league-wide scoring environment.
The other overlap with quarterback is that we did see a lot of slight-underdog receivers spring their way into perfect lineups. In fact, that sub-group produced perfect receivers at a rate higher than the expected baseline.
| Spread | Perfect WRs | Overall |
|---|---|---|
| Favored by 10 or More | 16.1% | 8.8% |
| Favored by 5 to 9.5 | 19.4% | 16.2% |
| Favored by Less Than 5 | 21.0% | 25.0% |
| Underdogs by Less Than 5 | 29.0% | 25.0% |
| Underdogs by 5 or More | 14.5% | 25.0% |
Again, you don't want to go overboard here; we're not targeting massive dogs. But if it's a projected tight game where the offense might need to throw a smidge more to keep up, that's a plus for the passing game.
With regards to scoring, things remained similar at receiver to how they've been in the past.
When I first wrote this piece analyzing the 2017 season, there seemed to be a baseline that a receiver needed to hit to make a perfect lineup. They needed to get either 85 receiving yards or 2 touchdowns, or else they wouldn't make the cut.
This year, the lowest yardage total for a receiver in a perfect lineup who didn't score twice was 94 from Christian Kirk, who had 9 receptions in that game. So, if anything, the threshold has inched up rather than declining. That allows me to feel good continuing to ask myself whether a receiver can get 85 yards or 2 touchdowns before plugging them into my lineup.
Tight End
If any position held firm to the "target close games" creed this year, it was tight end. It was the only position where the average perfect lineup selection was actually an underdog.
| Category | Average |
|---|---|
| Salary | $5,925 |
| Receptions | 7.1 |
| Receiving Yards | 96.0 |
| Receiving TDs | 1.5 |
| FanDuel Points | 21.8 |
| Roster Rate | 7.1% |
| Spread | 0.4 |
| Total | 46.7 |
| Wind | 4.5 |
| Home | 50.0% |
This average mark was in large part due to a glut of games with tight spreads. Thirteen of the 20 perfect-lineup tight ends (65.0%) came from games with tight spreads. But there also was just one double-digit favorite in the group.
| Spread | Perfect TEs | Overall |
|---|---|---|
| Favored by 10 or More | 5.0% | 8.8% |
| Favored by 5 to 9.5 | 10.0% | 16.2% |
| Favored by Less Than 5 | 30.0% | 25.0% |
| Underdogs by Less Than 5 | 35.0% | 25.0% |
| Underdogs by 5 or More | 20.0% | 25.0% |
We do want to be careful about drawing too many conclusions from a 20-player sample. That's especially true at tight end, where there are so few palatable options on a weekly basis. There are lots of factors here that could push us toward chalking this up to variance.
To me, the summation of all the spreads talk is just a slightly altered stance from the one I had entering the year. As a default, I'd still prefer to target players in games with higher totals and tighter spreads. Those are the circumstances most likely to breed shootouts, and even in a year where those options were more scarce, we still saw them play a key role in perfect lineups. That's always going to be my comfort zone.
The tweak will be being more comfortable with the heavily favored teams when I don't have my preferred options. I used them often out of obligation this year, knowing it was the right course of action but fearing they'd see reduced upside if they built a big lead. That's still a legitimate fear and a big part of why I'll skew toward the tighter games. But I can at least rest easier knowing this is a fine avenue when I don't have my preferred route.
The other interesting thing about tight end is that output varies wildly by salary among guys in perfect lineups. This is true for all positions, but the gap is massive here.
Of the 20 perfect tight ends, 8 had a salary of $6,000 or higher. Those guys averaged 121.8 receiving yards per game. Those with lower salaries were 42.9 yards lower than that.
| Salary | Receptions | Yards | TDs | FanDuel Points | Spread | Total |
|---|---|---|---|---|---|---|
| $6,000 or Higher | 9.1 | 121.8 | 1.3 | 24.1 | 1.1 | 46.4 |
| Lower Than $6,000 | 5.8 | 78.8 | 1.6 | 20.3 | -0.8 | 46.9 |
This doesn't mean we should automatically lower our standards for lower-salaried tight ends; you still need some points. It should, though, alter when we use them.
Because there's such a gap between the elite and the mid-tier at tight end, the production of the elite drives everything. If they come through, you need them in your lineup if you want that difference-making score. If they don't, then pretty much anything will do.
Basically, when you use a value play at tight end (unless they're getting a role change or a volume bump), you're making a bet against the elite options at the position. You're saying you think -- on that specific slate -- they'll come up short. It's more about being out on the high-salaried guys than it is being in on the cheapies.
Six of the 12 lower-salaried perfect tight ends failed to score 20 points, and only 2 got you 100 receiving yards. If Mark Andrews had been on the slate and done typical Mark Andrews stuff, the lower-salaried options likely wouldn't have made the cut. So -- unless there is a low-salaried player moving into an expanded role -- we should be most tempted by a value play at tight end when we expect the higher-salaried options to come up short.
Defense and Special Teams
At long last, my friends, we get to talk about my favorite subject across the entire DFS landscape: wind.
Across all games this year, the average wind speed was 6.0 miles per hour. For all the non-defensive positions, the average wind speed for players in the perfect lineup was 6.2 or lower.
At defense, that shot up to 9.7 miles per hour.
| Category | Average |
|---|---|
| Salary | $4,033 |
| FanDuel Points | 19.2 |
| Roster Rate | 5.4% |
| Spread | -2.5 |
| Total | 46.3 |
| Wind | 9.7 |
| Home | 50.0% |
We talk plenty about wind speed at quarterback and pass-catcher. It's possible we should flip that to the other side of the field, as well.
Of the 18 perfect defenses this year, 10 came from games with wind speeds in the double digits. That's despite only 27.1% of all games coming in blustery conditions.
| Wind Speeds | Perfect QBs | Perfect RBs | Perfect WRs | Perfect TEs | Perfect DSTs | Overall |
|---|---|---|---|---|---|---|
| 0 to 4 mph | 44.4% | 59.1% | 54.8% | 55.0% | 16.7% | 50.5% |
| 5 to 9 mph | 33.3% | 13.6% | 21.0% | 30.0% | 27.8% | 22.0% |
| 10 to 14 mph | 16.7% | 22.7% | 16.1% | 10.0% | 44.4% | 16.5% |
| 15-plus mph | 5.6% | 4.5% | 8.1% | 5.0% | 11.1% | 10.6% |
If you bring up wind on Twitter, you're likely to get some blow back (pun fully intended), saying that it's overblown (sorry). The data goes against that, both for the skill positions and at defense and special teams.
The other interesting data at defense and special teams pertains to totals. As you can see above, the average total for our perfect defenses and special teams was 46.3, dead even with the league average. That goes counter to the narrative that we want defenses in games with low totals.
There were some games that had lower totals, to be fair. But they were far from the default.
| Total | Perfect DSTs | Overall |
|---|---|---|
| 50 or Higher | 16.7% | 19.5% |
| 46 to 49.5 | 38.9% | 31.3% |
| 42 to 45.5 | 22.2% | 35.7% |
| Lower than 42 | 22.2% | 13.6% |
I don't think this is the result of a small sample, either.
Explaining that is easier when you think about how points are scored at defense and special teams. Sure, you score based on the number of points the defense allows, but the upside comes from targeting defenses that get sacks, interceptions, fumbles, and touchdown returns. Almost all of those events are more likely on a drop back than a rush attempt.
Games can have low totals because an offense is hideous. They can also go low, though, because a team is run-heavy, which keeps the clock rolling and decreases the number of plays in the game. Fewer plays -- and more rush attempts -- means fewer chances for those difference-making plays. That makes it tough to generate a score that'll help you take down a tournament.
You don't need to actively seek out games with high totals. Again, the baseline here was the league average. It's more so to say that you should be receptive to defenses in games with high totals, and you should be wary of games that have low totals due to projected rush-heavy scripts and a lack of pass attempts.
The data says we can also be a bit more laid back with regards to targeting defenses that are favored. For cash games, this is a plus because it likely means the opposing team will be in a negative script, thus dropping back more often. But for tournaments, we don't need that to get a big score.
| Spread | Perfect DSTs | Overall |
|---|---|---|
| Favored by 10 or More | 16.7% | 8.8% |
| Favored by 5 to 9.5 | 16.7% | 16.2% |
| Favored by Less Than 5 | 27.8% | 25.0% |
| Underdogs by Less Than 5 | 27.8% | 25.0% |
| Underdogs by 5 or More | 11.1% | 25.0% |
It's a similar story to the other positions: as long as the team is projected to put up a fight, we don't need to cross them off.
At defense, we should aim to be less rigid than we've been in the past. We should seek out defenses that will face a bunch of pass attempts, whether due to pace or game script, ideally against a pass game prone to mistakes. Targeting a defense playing in high winds can increase said mistakes. That approach could lead us to teams that are heavily favored in games with low totals, but we don't need to be as narrowly focused as perception here.


