


Fantasy Football: What Last Year’s Pace Trends Tell Us About 2020
If you do your own fantasy football projections, pace of play and total play count are large factors in building a model.
Conceptually, you would think that the faster a team plays, the more opportunities it might have to score. But there's more to it than just that, as pace of play can give you a lens into a team's offensive philosophy.
Hopefully this post will give you an idea of how teams fared in 2019 and over the past couple of years, as well as how this impacts fantasy football for 2020.
All data used in this article (unless otherwise noted) is from the nflfastR play-by-play repository and is filtered on only running and passing plays.
2019 Recap
As a lead-in to looking at historical data, I wanted to introduce some statistics regarding the predictability of pace of play both year-over-year as well as within the same season. In fantasy football, predicting the future is our main goal, so it's important to understand how much the past influences the future.
The R squared (proportion of the variance for a variable that's explained by another variable) for offensive year-over-year pace of play is only 0.15, so it's not that strongly correlated. I then wanted to find out if coaching changes had anything to do with the instability, so I removed all of the seasons in which a new head coach was hired. With that set of data, the R squared was still only a measly 0.17.
Furthermore, defensive seconds per play does little to explain same-season offensive seconds per play. The R-squared for in-season offensive and defensive seconds per play is only 0.11. Although there's no real correlation between these stats, it's still worthwhile taking a peek at how teams performed last year to help inform our projections for the upcoming year.
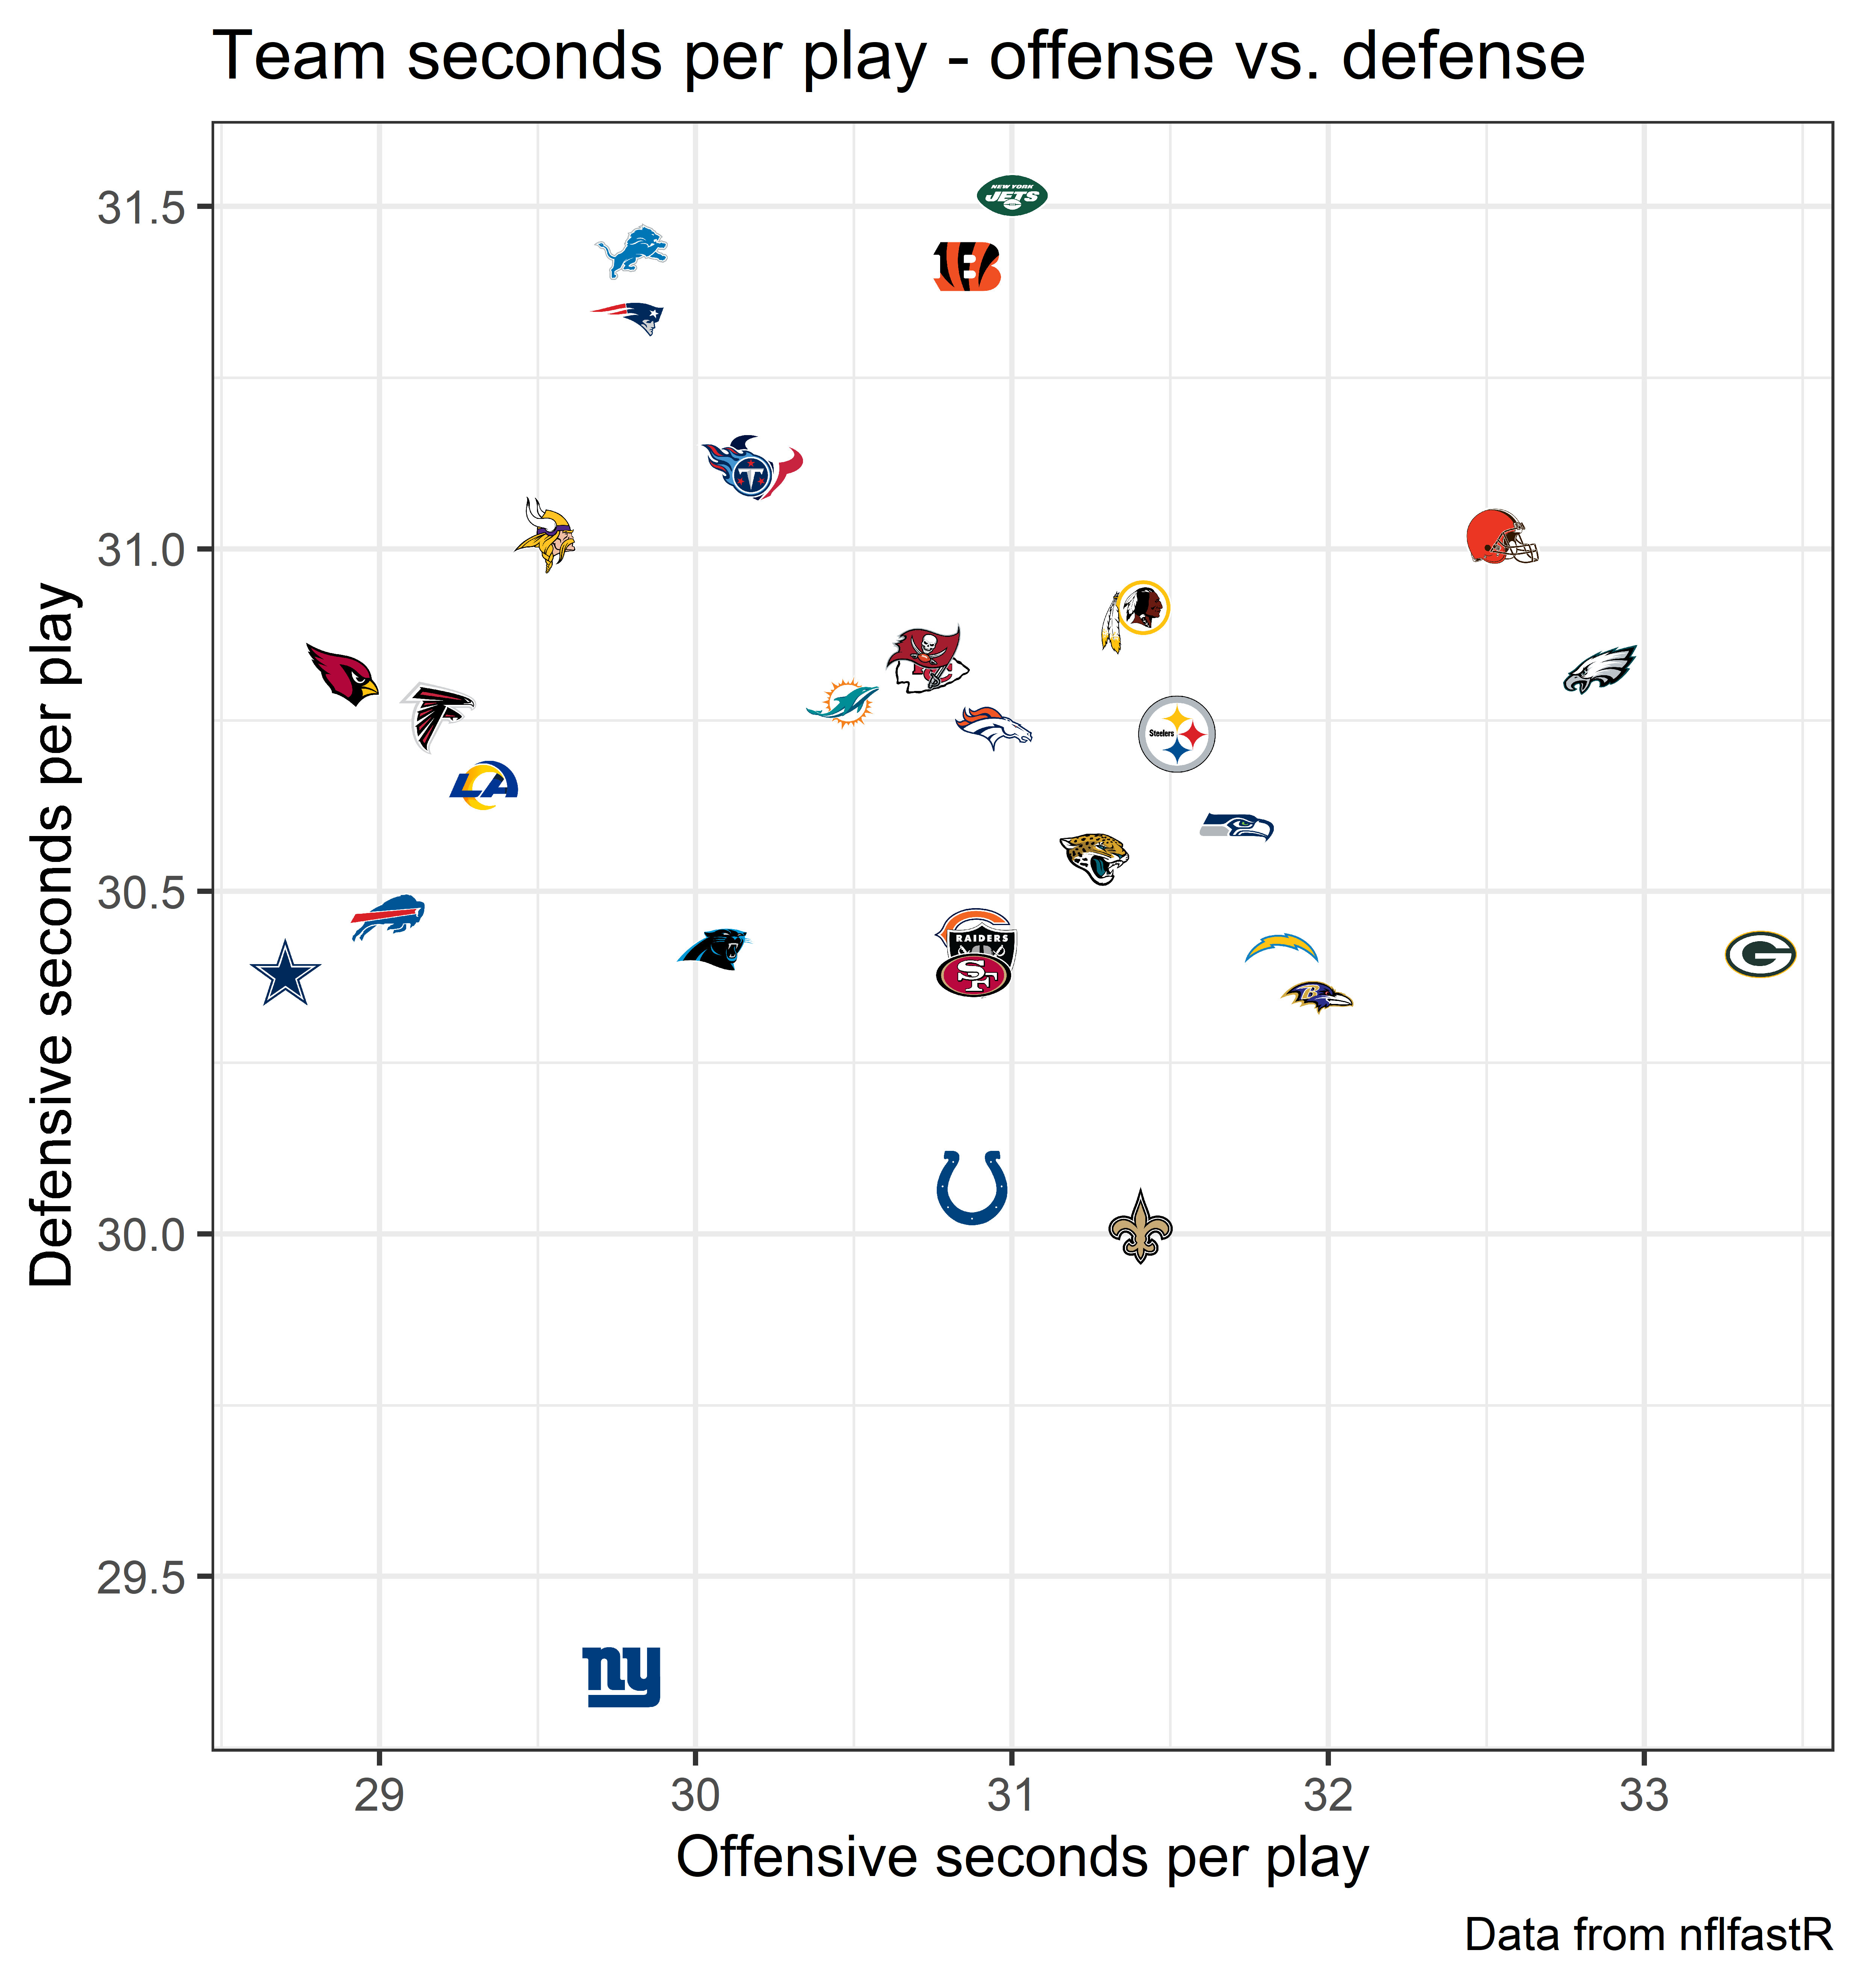
Among the leaders in offensive seconds per play last year were the Dallas Cowboys (28.7), Arizona Cardinals (28.9), and Buffalo Bills (29.0) -- three teams with varying offensive philosophies. Conversely, the Green Bay Packers (33.4), Philadelphia Eagles (32.9), and Cleveland Browns (32.6) were at the bottom of the league in offensive seconds per play.
As you'll notice, the New York Giants were the only team under 30 seconds per play on both offense and defense last year. This is particularly intriguing given the Giants ranked 18th in offensive plays per game and 27th in defensive plays allowed per game.
Game Script Analysis
Going a step further in my pace-of-play analysis was to take a look at how teams performed under different game scenarios. Understanding pace of play in neutral game scripts is perhaps the best way to recognize how fast teams play when they're not forced into passing the ball late in the game or trying to burn the clock by draining the play clock.
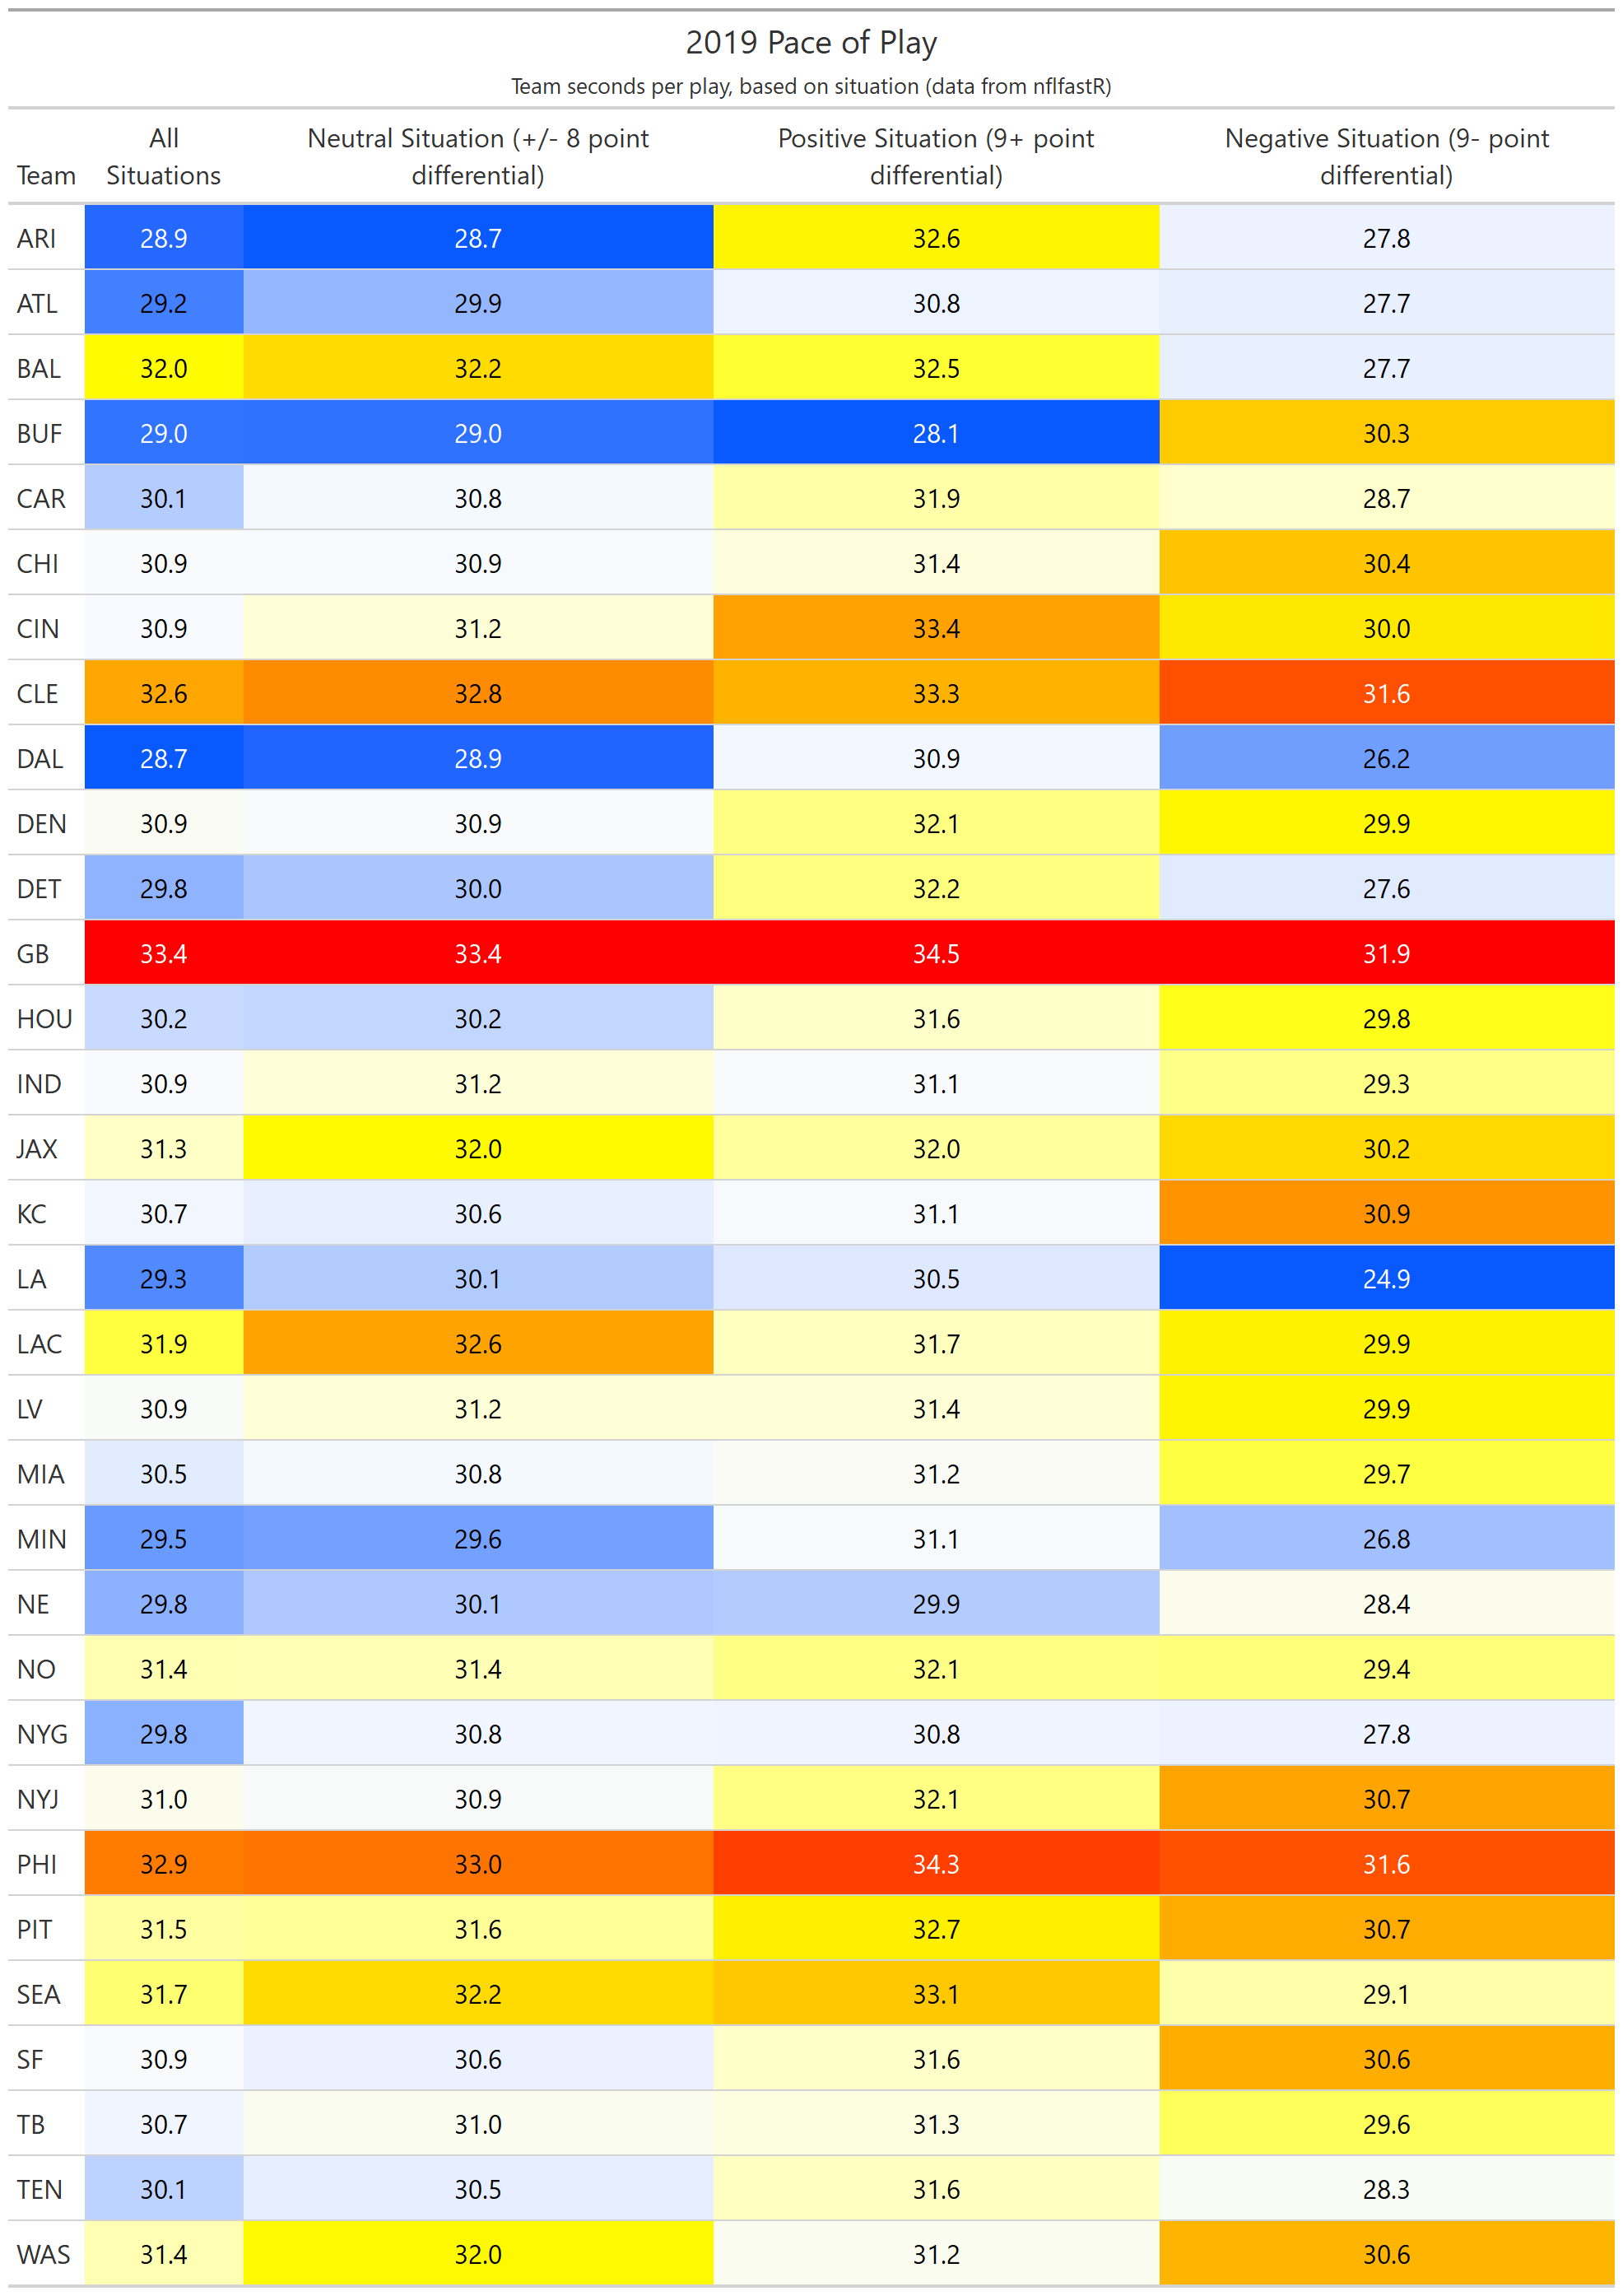
Teams didn't vary much from their overall seconds per play compared to their neutral game script seconds per play. With that, it's best to make comparisons to neutral game script pace of play so as not to compare overlapping datasets.
On average, teams ran a play 0.8 seconds per play slower in positive game scripts than they did in neutral game scripts. Amazingly, there were five teams that actually sped up their pace of play when in a positive game script: the Los Angeles Chargers, Buffalo Bills, Washington Redskins, New England Patriots, and Indianapolis Colts. The aforementioned Cardinals had the largest difference between neutral and positive game scripts, running a play an average of nearly four seconds per play slower when they were ahead.
Conversely, teams ran a play an average of 1.7 seconds per play faster in negative game scripts than they did in neutral game scripts. Only two teams -- the Bills and Kansas City Chiefs -- were slower when facing a negative game script.
Two teams in particular noticeably sped up in negative game scripts. The Los Angeles Rams went from averaging just over 30 seconds per play in neutral game scripts to just under 25 seconds per play in negative game scripts -- over a five second difference! Similarly, the Baltimore Ravens, who rarely found themselves in a negative game script last year, jumped from 32.2 seconds per play in neutral game scripts to 27.7 seconds per play in negative game scripts.
If either of these teams' defenses (which both finished inside the top 10 in Adjusted Defensive Net Expected Points per play) regress even some, we could see some dramatic swings in their 2020 pace of play.
Scoring Drives
Scoring is one of the most influential aspects of fantasy football because of how much weight touchdowns carry on a weekly and yearly basis. The following table highlights how teams performed on touchdown-scoring drives only, giving us an idea of how teams were able to score.
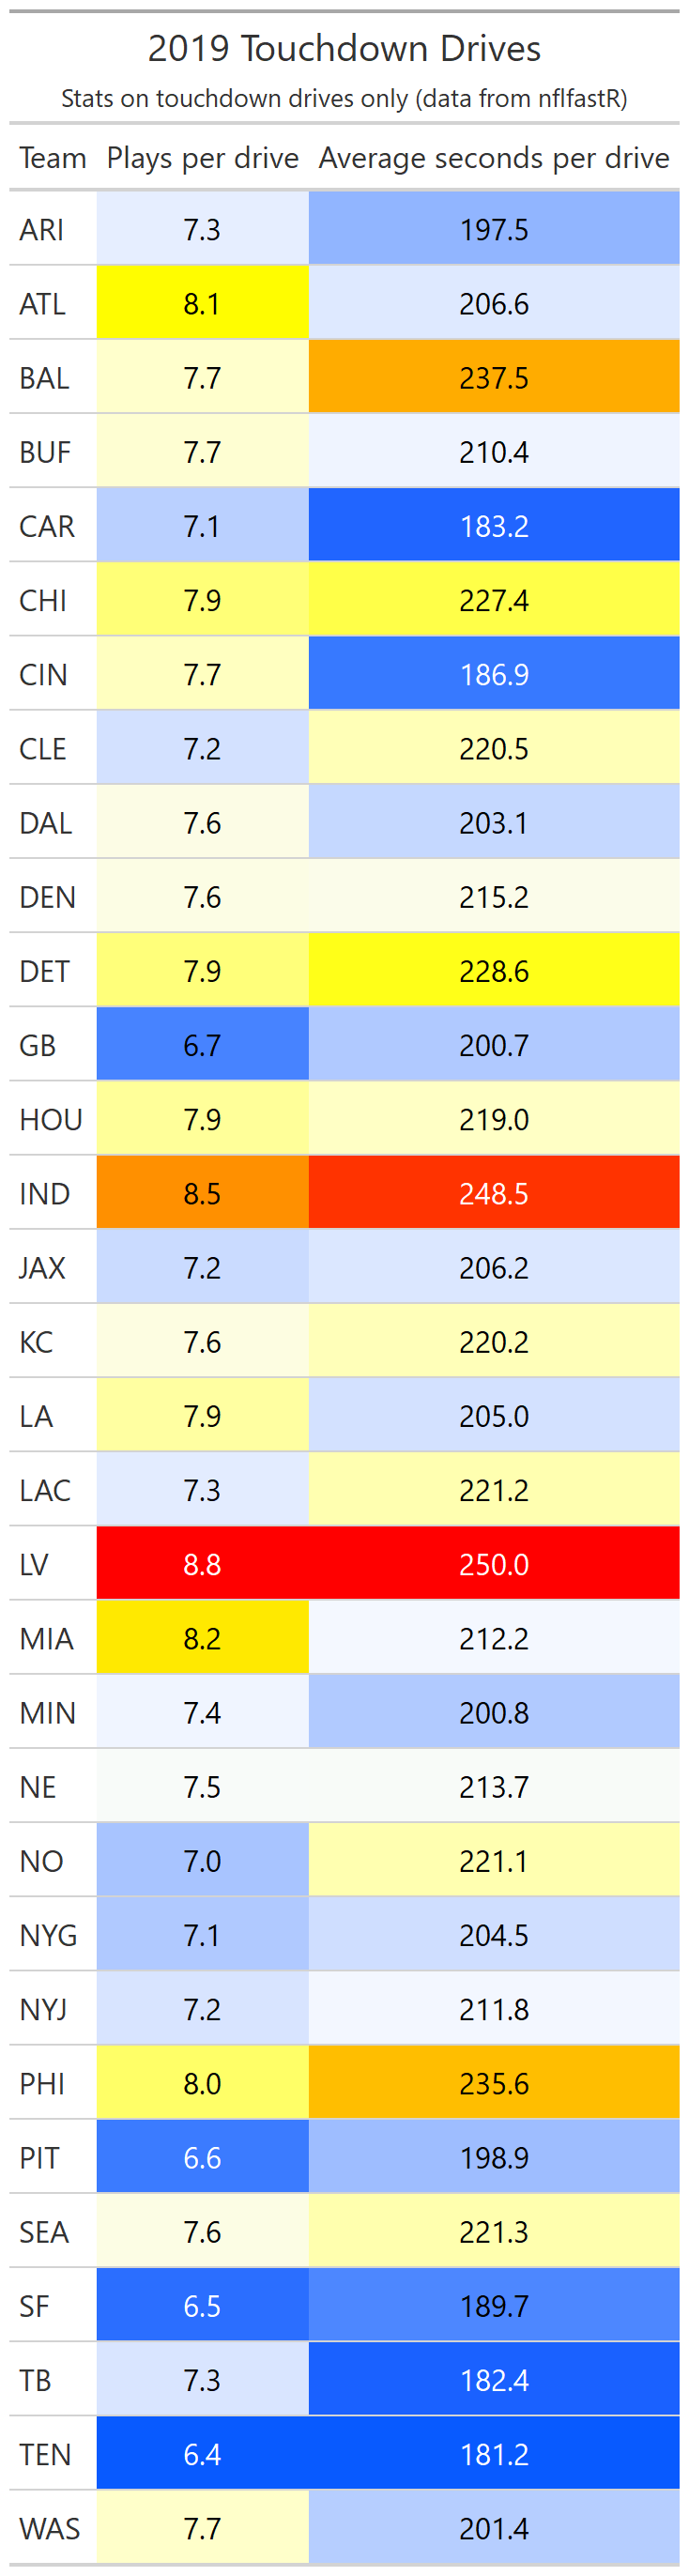
Likely thanks to the breakout of A.J. Brown and the extreme efficiency of the Ryan Tannehill-led offense, the Tennessee Titans led the NFL in both fewest plays per touchdown drive (6.4) and seconds per scoring drive (averaging just over three minutes). The San Francisco 49ers and Pittsburgh Steelers were not far behind the Titans, averaging 6.5 and 6.6 plays per scoring drive, respectively.
Surprisingly, despite being one of the slowest teams in the NFL last year, the Packers finished in the top five in plays per scoring drive at 6.7 and did so fairly quickly at around three-and-a-half minutes per drive.
The Las Vegas Raiders came in as the NFL's slowest team scoring the ball, averaging nearly nine plays per scoring drive while taking over four minutes of game clock to do so. Additionally, the Colts' offense was sluggish when scoring the ball as one of the five teams to average at least eight plays per scoring drive. This offseason, Indianapolis brought in Philip Rivers, who averaged one fewer play per scoring drive last year -- we'll see if he can bring that same level of efficiency to the Midwest.
2020 Outlook
As we look forward to 2020, it's important to note how teams have been trending over the past couple of seasons. The below chart compares each teams' 2019 offensive seconds per play (displayed by its team logo) to that of its average offensive seconds per play from 2016 through 2018 (displayed as the dot connected to the logo).

A team's logo appearing above the dot means they ran a slower pace of play in 2019 compared to its average, while a team's logo appearing below the dot means they ran a faster pace of play in 2019 compared to its average.
Aaron Rodgers is very well known for winding the play clock down to the waning seconds before snapping the ball, giving Packers fans everywhere heart palpitations as they wait for him to start the play. With rumors that this team will continue to be focused on running the ball, expect this slow pace of play trend to continue into 2020.
Similarly, the Baltimore Ravens' pace of play dropped significantly despite having one of the most electric offenses in all of football. The league leaders in points per game ran an offensive play three seconds per play slower than they had in the prior three seasons. Conventional wisdom would suggest that you need to have a high rate of plays to be scoring that much, but keep in mind that the Ravens averaged 6.1 yards per play (third in the league) and they had the most clock-moving plays (rush attempts plus completions) in 2019 with 885.
On the opposite side of that trend, we see the Kliff Kingsbury effect in full force with the Arizona Cardinals. The Cardinals jumped up considerably in seconds per play in their first year under the new head coach, running a play two seconds faster than before Kingsbury arrived.
Though not as dramatic, the Carolina Panthers also made a leap in offensive seconds per play, running plays about 1.5 seconds faster than previously. Having brought in Matt Rhule from the college ranks, it will be interesting to see if they have another spike in play rate in 2020.
Finally, the Detroit Lions saw a boost in pace of play in their first year with Darrell Bevell as offensive coordinator. For a man that was very well known for pounding the rock in Seattle, the Lions passed the ball over 60 percent of the time on their way to finishing inside the top 10 in seconds per play.


