


NFL Analytics: Positional Success Rates Allowed Through Week 15


As fantasy football players, we need to study matchups each and every week.
How exactly to determine the best matchups can be tricky, but rather than look just at yards per carry or passing yards per game allowed, I like to lean on numberFire's Net Expected Points (NEP) metric in various ways. NEP indicates expected points gained for a team's offense -- or denied by a team's defense.
Here's a good example of why it matters. A 15-yard catch looks great on paper, especially compared to a 5-yard catch. But if the 15-yarder comes on 3rd-and-20, it's not very impactful. If the shorter gain comes on 3rd-and-2, it's a significant play and boosts the offense's scoring expectation. It was a success.
Adding this context can show us which teams defend positions well and which teams may have their traditional stats inflated by plays that don't matter as much as others.
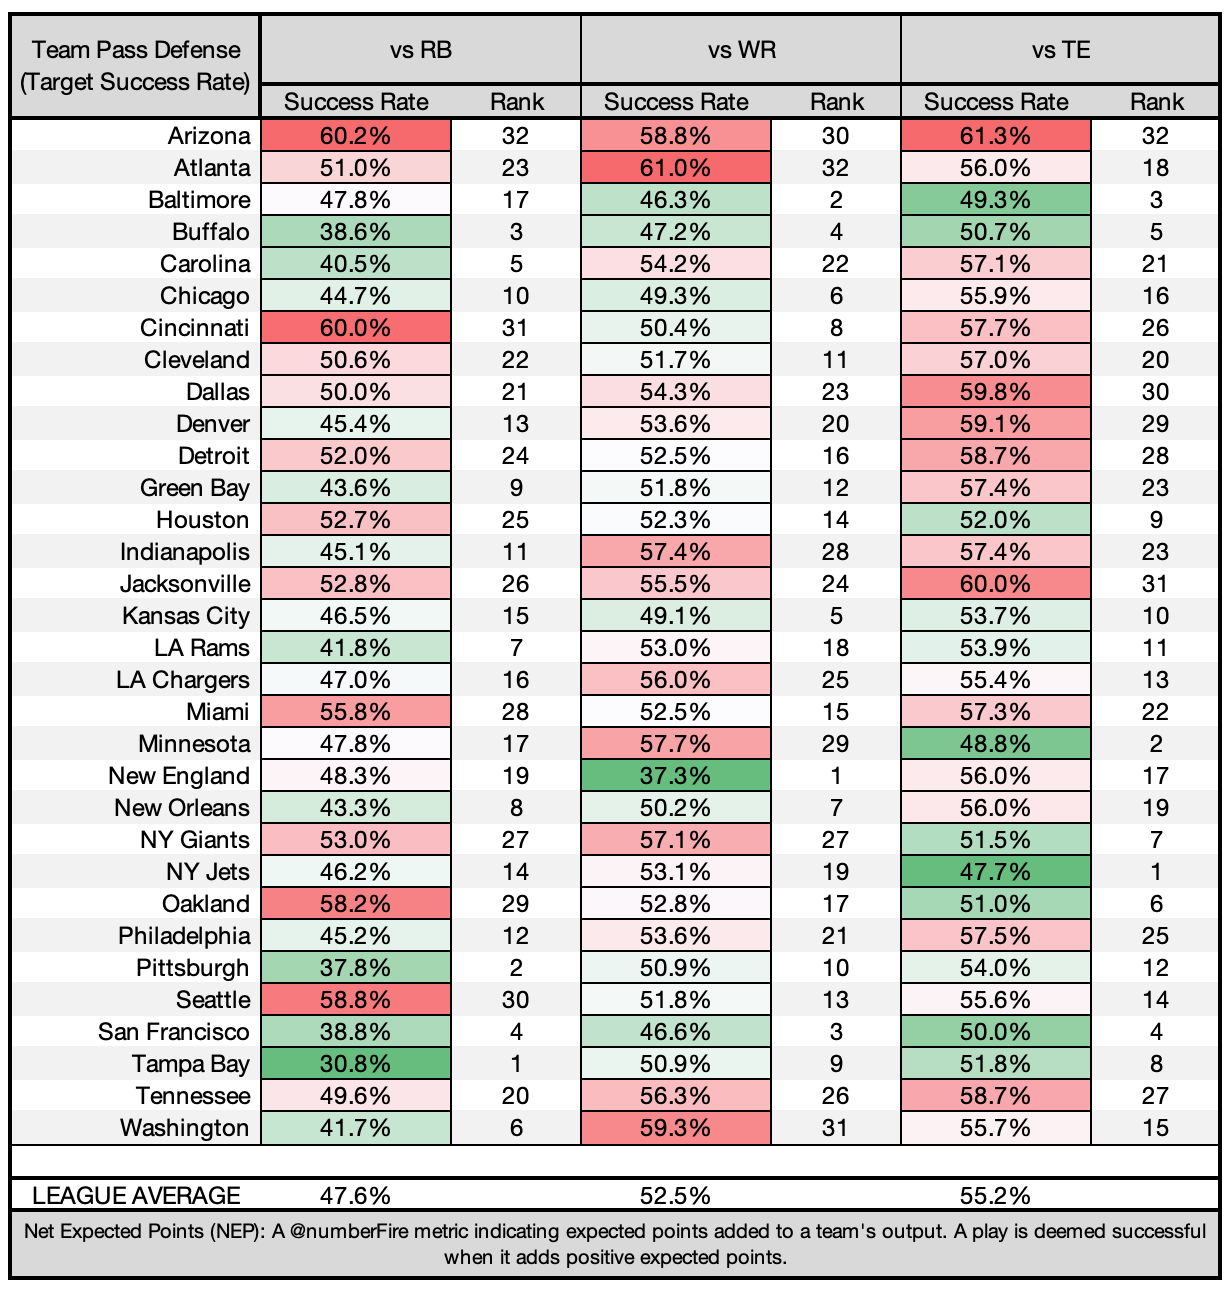
You can view our overall, opponent-adjusted passing and rushing defense numbers on our team rankings page, but here's a breakdown of Success Rates allowed to the various positions across the NFL through Week 15's games.
Numbers shaded with green indicate good defensive metrics -- and poor offensive matchups. Red cells indicate weak defensive performance and promising offensive matchups.
Quarterback Pass Defense

Best and Worst Since Week 8
| Rank | Team | Success Rate Allowed | Rank | Team | Success Rate Allowed |
|---|---|---|---|---|---|
| 1 | Tampa Bay | 39.9% | 32 | Arizona | 54.1% |
| 2 | Baltimore | 40.1% | 31 | Detroit | 53.5% |
| 3 | Philadelphia | 40.1% | 30 | Seattle | 52.3% |
| 4 | Pittsburgh | 40.4% | 29 | Jacksonville | 51.4% |
| 5 | Buffalo | 41.0% | 28 | Tennessee | 51.0% |
| 6 | LA Rams | 41.2% | 27 | Atlanta | 49.8% |
| 7 | Kansas City | 41.2% | 26 | Denver | 49.0% |
| 8 | New Orleans | 43.1% | 25 | NY Giants | 48.9% |
Running Back Rush Defense

Best and Worst Since Week 8
| Rank | Team | Success Rate Allowed | Rank | Team | Success Rate Allowed |
|---|---|---|---|---|---|
| 1 | NY Jets | 27.0% | 32 | Atlanta | 50.0% |
| 2 | NY Giants | 32.7% | 31 | Minnesota | 48.7% |
| 3 | Indianapolis | 33.9% | 30 | Green Bay | 48.4% |
| 4 | Philadelphia | 34.7% | 29 | Carolina | 47.5% |
| 5 | New Orleans | 35.7% | 28 | Baltimore | 45.5% |
| 6 | Chicago | 36.0% | 27 | Miami | 45.0% |
| 7 | Tampa Bay | 37.0% | 26 | Jacksonville | 44.8% |
| 8 | Seattle | 37.3% | 25 | Oakland | 44.6% |
Receiving Defense
Best and Worst Since Week 8
| RB Rank | Team | Success Rate Allowed | RB Rank | Team | Success Rate Allowed |
|---|---|---|---|---|---|
| 1 | Tampa Bay | 27.9% | 32 | Seattle | 66.0% |
| 2 | Philadelphia | 31.4% | 31 | Detroit | 60.8% |
| 3 | San Francisco | 34.6% | 30 | Arizona | 59.7% |
| 4 | Chicago | 36.6% | 29 | Oakland | 57.1% |
| 5 | Pittsburgh | 37.0% | 28 | Jacksonville | 54.8% |
| 6 | Baltimore | 37.5% | 27 | Tennessee | 54.7% |
| 7 | Buffalo | 38.3% | 26 | Cleveland | 53.5% |
| 8 | LA Chargers | 40.6% | 25 | Cincinnati | 52.9% |
| WR Rank | Team | Success Rate Allowed | WR Rank | Team | Success Rate Allowed |
|---|---|---|---|---|---|
| 1 | Kansas City | 42.9% | 32 | Jacksonville | 61.0% |
| 2 | Baltimore | 48.4% | 31 | Minnesota | 59.9% |
| 3 | Cincinnati | 46.2% | 30 | Detroit | 59.5% |
| 4 | Chicago | 46.5% | 29 | Tennessee | 59.3% |
| 5 | Houston | 47.2% | 28 | Arizona | 57.9% |
| 6 | Buffalo | 48.0% | 27 | Carolina | 57.5% |
| 7 | Tampa Bay | 48.3% | 26 | Atlanta | 57.0% |
| 8 | Pittsburgh | 48.4% | 25 | Washington | 56.2% |
| TE Rank | Team | Success Rate Allowed | TE Rank | Team | Success Rate Allowed |
|---|---|---|---|---|---|
| 1 | Baltimore | 41.2% | 32 | Jacksonville | 69.2% |
| 2 | Minnesota | 45.3% | 31 | Denver | 64.5% |
| 3 | LA Rams | 46.5% | 30 | Atlanta | 59.3% |
| 4 | NY Jets | 48.0% | 29 | Cincinnati | 59.1% |
| 5 | Tampa Bay | 48.1% | 28 | Dallas | 58.6% |
| 6 | Oakland | 48.3% | 27 | Washington | 57.7% |
| 7 | Philadelphia | 50.0% | 26 | San Francisco | 57.4% |
| 8 | Indianapolis | 50.9% | 25 | New England | 56.7% |


