


Fantasy Football: A Mathematical Look at Positional Value for 2018


My house was once a foreclosure listed on Auction.com. I bought it on that website four years ago without ever first taking a step in the house. And it was the scariest thing I've ever done.
My wife and I drove by it like a wannabe Chip and Joanna Gaines, pointing at how many obvious repairs the home needed from the exterior. The siding and window sills were rotting out, the back porch was made exclusively of decking boards untreated since 1985, and the air conditioning unit had plants growing through it. We peeked through the windows and saw that similar issues of negligence extended into the interior of the home. But we loved the neighborhood, and we weren't afraid to do a lot of the work ourselves.
We bought the house at a good price and made a budget of all the repairs we knew we wanted to make. We allocated one sum of money to upgrading the kitchen, another to repairing the siding, and so on. But, soon, our budget was in disarray. We completely overestimated the cost of some items, underestimated others, and even had new unforeseen projects arise.
We had a pretty solid plan laid out when we first started, but due to the unpredictable nature of such a task, we had to embrace a wide range of possible outcomes.
Fortunately, we had the foresight to budget some contingency for the known unknowns. When the inevitable problems arose, we were prepared to adjust accordingly. The unpredictability was very much a part of the budget.
I couldn't help but be reminded of fantasy football throughout this process. With projections, assumptions, and Twitter highlight reels that embolden our confidence in specific players, we often don't accurately embrace the volatility that exists beyond Week 1 of the NFL season. Specifically, we don't accurately acknowledge the predictability of our assumptions at the positional level. Our ability to accurately predict within the position should be a key factor in defining the value of one position over another.
We know that positional value is affected by scarcity, league format, league-wide trends, and several other factors. But today let's take a look at positional predictability and how to properly budget for variance in your fantasy football lineup.
Games Missed
Using average draft position data (ADP) over the past three seasons from FantasyFootballCalculator.com, I first looked at time missed to help understand the reliability of the players we take on draft day.
Here's a look at how many games were missed from Weeks 1 through 16, on average, among the top-48 drafted running backs, the top-48 wide receivers, and all drafted quarterbacks and tight ends.
| Year | QB | RB | WR | TE |
|---|---|---|---|---|
| 2017 | 2.96 | 3.60 | 2.83 | 2.95 |
| 2016 | 1.27 | 4.02 | 3.02 | 2.82 |
| 2015 | 2.45 | 3.00 | 2.90 | 1.94 |
| Average | 2.23 | 3.54 | 2.92 | 2.57 |
To no surprise, the running backs paced the league in games missed, averaging 0.62 more games on the shelf than their fellow wide receivers. The old NFL saying holds true in fantasy: the most valuable ability is availability.
Cycling Through Starters
Many analysts commonly refer to "usable weeks" when referencing how many times a running back had a top-24 week or a quarterback finished in the top-12. One major flaw with this analysis is that it doesn't consider whether that player was realistically on your radar for consideration in your starting lineup for that given week.
For example, in Week 3 against Baltimore, Marcedes Lewis caught 4 of 5 targets for 62 yards and 3 touchdowns. He was the TE1 that week, but his FantasyPros consensus rank heading into that week was the TE48. With the exception of daily fantasy tournament lineups, nobody was even considering playing Lewis that week, so we can't really consider his week usable.
So, I'm going to use the term "lineup-worthy" to describe players who were recommended options at their positions. For this purpose, I defined "lineup-worthy" as any player ranked in the top X of consensus ranks heading into the week, regardless of number of points scored. The goal here is to see how much turnover exists at each position.
Here are the last two years of data courtesy of FantasyPros for Weeks 1 through 16.

What you're seeing here is that, in 2016, two quarterbacks were recommended as top-12 plays 15 separate times (remember, each player has a bye week). And two more of them were recommended as top-12 plays 14 times.
Are you shocked to see that there are so few quarterbacks that were recommended as QB1s?
The same is true at tight end, which suggests a lot of turnover in the weekly recommendations at each position. Both of these positions have averaged 25.5 different players per year to offer at least one week ranked inside the top 12. (Remember, we're talking about how we viewed them prior to a given week, not after it.)
We all feel different about what we believe a "lineup-worthy" ranking is, and realistically it depends on how you've structured your roster. If you're streaming the quarterback position, you likely feel comfortable starting players in the top-18 or so at the position, for example. Perhaps starting a running back tucked just inside the top-45 makes you want to vomit. So, you're more than welcome to set the standard wherever you'd like.
One interesting thing to note is that lineup-worthy running backs appear to cycle through at a higher rate, regardless of where we set the threshold (top-24, top-36, etc.). That's partly because they miss more games than players at other positions, but it's also due to the fluid nature of the positional battles.
The supply is greater at the running back position than we probably realize throughout the year.
Predicting Performance Annually
Next, I took a look at predictability by examining the last five years of positional draft data from FantasyFootballCalculator's historical information. Rather than compare ADP to scoring, I decided to use position rank within the draft to see how good we are at selecting the order in which each player should go at his position. So the x-axis in the graphs below represents positional rank at the draft, while the y-axis is points scored (half PPR) by players at that rank.
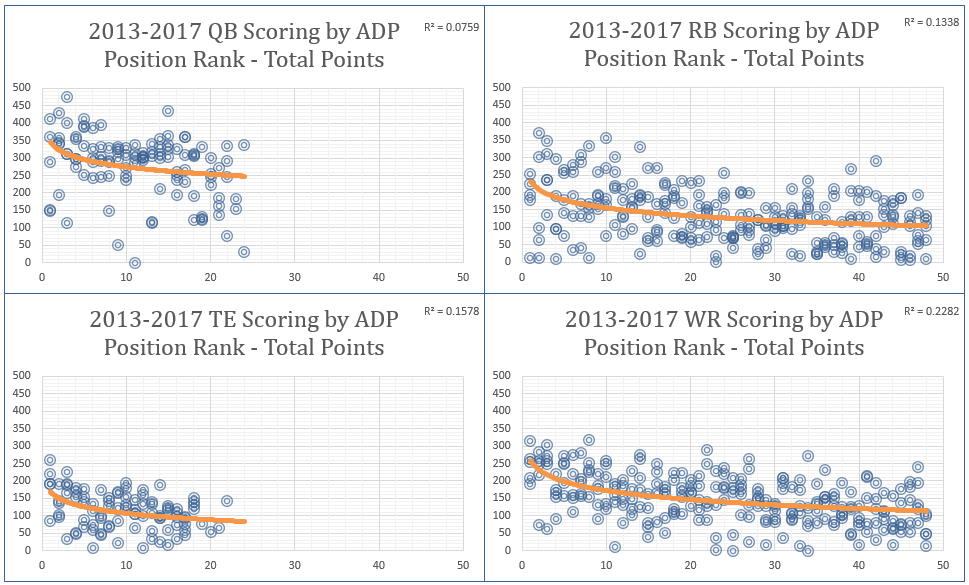
To be blunt, we aren't particularly good at sorting out the players at each position. But some of that has to do with the unpredictable nature of missed games at the individual player level.
So let's see how that translates if we adjust for points per game rather than total points for the year.

Our variance does improve with the adjustment to points per game. However, we still fail to explain even a majority of scoring by using drafted position rank as an indicator. The r-squared value on each graph displays the degree of explanation provided by the trendline.
Using full-season total points as our baseline, we see the least volatility from wide receivers, followed by tight ends, then running backs, and surprisingly quarterbacks are last. If we adjust for games played, tight ends cluster more closely to the trendline, followed by wide receivers, then running backs, and quarterbacks.
Of course, these r-squared values can and will change depending on the number of players we're measuring. Above, we're looking at top-24 quarterbacks and top-48 running backs and wide receivers, for instance. These are logical end points, but they're relatively arbitrary, in the end.
Predicting Weekly Performance
Let's head back to our FantasyPros expert consensus ranks to see just how well the weekly rank translated into fantasy points.
What would perfect weekly rankings look like? Well, they would consistently identify the weekly WR1 as the wide receiver who scores the most points in that upcoming week. Then, the WR2 would be the wide receiver who scores the second most points that week, the WR3 would be the wideout with the third-most points, and so on.
When charting weekly ranking versus points scored, the results are quite scattered but do follow a basic trendline. Here's a look at the charts for the top-24 quarterbacks, the top-24 tight ends, and the top-48 running backs and wide receivers. To reiterate, the x-axis is the player's positional rank entering the week, and they y-axis is the points produced during that week.

The r-squared displayed in the upper right corner of each graph indicates that the quarterback position introduces the most volatility (sheer positive or negative deviation in terms of actual fantasy points) into our fantasy lineups, while running backs produce the most consistent results based on expectations from position rank.
Again, it should be noted that these end points are slightly arbitrary. If we were to extend the quarterback rankings to, say, QB40, the r-squared value would become stronger. We're then predicting backup quarterbacks, and we know backup quarterbacks won't perform well in a given week. That increases predictability.
Even still, it's interesting to see that among starters and most backups, quarterbacks are the most volatile week to week.
Or are they?
Introducing Some Nuance
While r-squared does a great job of telling us how much raw variance we have in our lineup, the Coefficient of Variation (CV) better explains our overall ability to predict relative to the trendline.
Think of it this way: the stock price for Google is currently hovering just over $1,100 per share, while Ford Motor Company trades for roughly $11 per share. Imagine each one sees a $3.00 standard deviation in price.
Which one is the least predictable?
An r-squared analysis would reveal that both stocks experience equal variance. But Coefficient of Variation (a dataset's standard deviation divided by its average) would reveal that a $3.00 deviation is much less significant for Google, as Google has a much higher average price. That makes it the more predictable company.
So when we make claims about predictability at the positional level, it's important to do two things. First, we must analyze variance relative to the mean score at the position using CV. The lower the CV, the more predictable it is. Second, we must recognize that different clusters of players carry different levels of predictability.
Given this, I've categorized each position in increments of six based on the FantasyPros weekly recommendations. Below is the CV for each position cluster's output. (These are players ranked in Weeks 1-16 during 2016 and 2017):
| Min Rank | Max Rank | QB | TE | RB | WR |
|---|---|---|---|---|---|
| 1 | 6 | 33.9% | 63.3% | 49.5% | 61.6% |
| 7 | 12 | 39.0% | 65.5% | 55.2% | 58.6% |
| 13 | 18 | 39.7% | 70.9% | 59.7% | 58.7% |
| 19 | 24 | 43.6% | 88.4% | 61.7% | 61.6% |
| 25 | 30 | 67.9% | 66.1% | ||
| 31 | 36 | 65.3% | 67.9% | ||
| 37 | 42 | 74.7% | 71.5% | ||
| 43 | 48 | 93.2% | 69.2% | ||
| 49 | 54 | 101.4% | 77.7% | ||
| 55 | 60 | 128.1% | 77.0% |
While quarterback introduces the greatest degree of volatility to the fantasy lineup based on raw points (from earlier), this table reveals that the position is the most predictable relative to its elevated mean. This is an important distinction to grasp -- quarterback is both predictable and volatile. Both are important to consider when making roster decisions.
Just behind quarterbacks, top-12 running back options are most predictable, followed by wide receivers 7 through 18. Strangely, top-six wide receivers are less predictable by comparison. This unpredictability stems from massive outlier scores that while raising the mean, have significantly greater impact on the standard deviation.
In English, when these guys ball out, they blow the roof off. With the exception of that one group of players, running backs and wide receivers show a similar degree of weekly predictability.
Tight ends are much less predictable than the other positions across the same clusters. Even the best tier of players is relatively unstable compared to the mean on a weekly basis.
All together, we see quarterbacks as the most predictable, followed by running backs and wide receivers as a similar pair, and tight ends last.
Wrapping Up
From the data I presented last week, we learned that 2017 was a major outlier for the state of the passing game in today's NFL. As a result, early ADP data suggests that most fantasy players are inclined to lean heavily on running backs early and often, even more than in 2017. While there's clearly value to be found in bell-cow running backs, we must acknowledge the predictability of the position in comparison to the others.
What do we know about running backs? They miss more time than any other position. They see more lineup-worthy options that present themselves over the course of a season. They are the second-most volatile position in terms of season-long scoring above and below expectation. They offer the least variance (r-squared method) based on weekly position rank, meaning we can predict scoring outputs well in-season. And they are approximately as predictable (CV method) as wide receivers relative to expectation.
In other words, I don't buy into the argument that you should invest in running back because everyone else is doing so. While I agree that the top-four options for 2018 (Le'Veon Bell, David Johnson, Todd Gurley, and Ezekiel Elliott) offer unique value, there's plenty of reason to fade the running backs drafted behind that cluster in favor of the falling value at wide receiver and tight end. Running back has a reputation of being an irreplaceable position, but we see that lineup-worthy options cycle through at a higher rate than any other position.
Use your awareness of unpredictability to brace for the variance.
Remember, when you start knocking down those walls in your fixer upper, you're a lot more likely to find mold than reclaimed 18th century shiplap. Budget for the craziness, remember just how wrong you're likely to be, and you'll be uniquely suited to endure and thrive in 2018.


