


How Does Ronald Jones Fit With the Buccaneers?


In a rookie draft class full of running back talent, it takes a special player to break through the clutter. Former USC running back Ronald Jones II has shown the kind of big-play ability necessary to terrorize NFL defenders, getting practice ravaging Pac-12 defenses for the last three years.
Jones has proven that he can provide upside on the ground -- topping 950 yards rushing each year in college -- but questions remain about whether or not he can be an every-down back at the next level. Critics are skeptical that he can survive a full-time workload (he carried the ball more 200 times just once in three years at USC) or develop into a pro-caliber backfield receiver (he caught a total of 32 passes in college).
Can Jones be the reliable talent at running back that fantasy players covet, or will he remain a boom-or-bust proposition?
The Player
Jones spent 2015 and a good chunk of 2016 behind starter Justin Davis, but he still earned plenty of work in the Trojans’ rushing attack. He averaged 165 carries and 1,035 yards across those two seasons as a backup; a lofty average and one that a fair number of starters in lesser offenses don’t top.
With Jones therefore playing in a part-time role those seasons, it’s tough to evaluate his raw total production. Instead, we can look at his rushing yards per attempt and touchdown rate (rushing touchdowns per attempt) over his time in college to show his progression or regression in those areas.
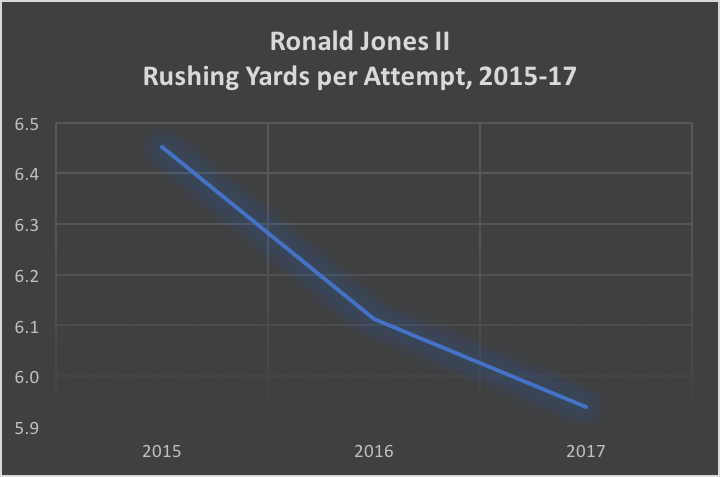
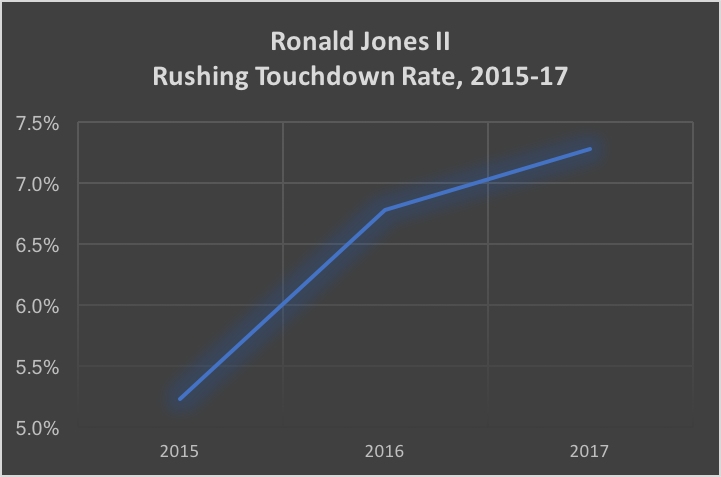
Instead of improving his rushing prowess through the years, as Jones’ attempts increased, his efficiency dropped, which isn't uncommon. Somewhat surprisingly, his touchdown rate starkly improved as he picked up more carries, but this was possibly a function of just being given more carries overall; with more total carries, he also saw more of the valuable goal-line carries.
These results are somewhat worrisome for Jones’s bell-cow potential. Perhaps he could be extremely efficient in a lower-volume role, but it’s possible that his production would be average or slightly below average if given a high count of touches (although high-volume backs can be fantasy studs even without superb per-play efficiency). This is colloquially known as the “Lamar Miller Effect†-- Miller averaged 12.2 carries per game with the Miami Dolphins from 2013 to 2015, picking up 4.57 yard per carry. When he joined the Houston Texans, Miller averaged 16.9 carries per game and dropped to 3.88 yards per carry.
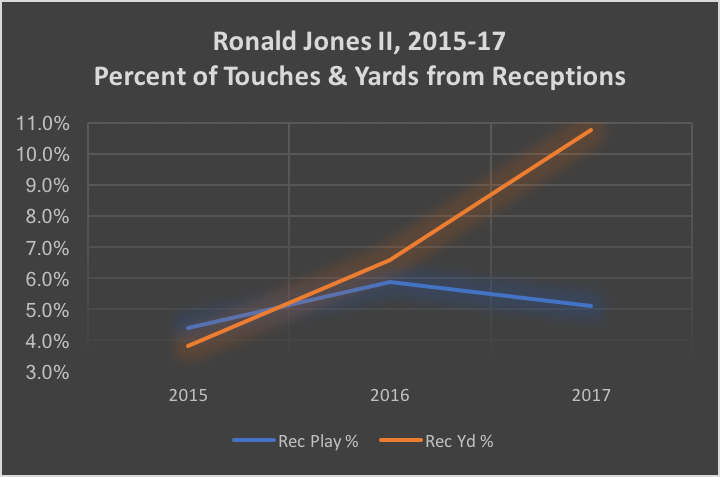
Additionally, though Jones was never a prolific pass-catcher in college, he did improve that part of his game over his time at USC. The chart below shows his percentage of touches and yards from scrimmage on receptions, both of which drastically increased in his three years.
Despite exceptional tools that put him in the 87th percentile among running backs since 2000 in terms of Speed Score (weight-adjusted 40-yard dash), Jones has a middling overall profile and some red flags that could limit him in the NFL. Jones could be best suited as an explosive change-of-pace back in the pros, a Tevin Coleman-esque “1B†to some other runner’s “1Aâ€.
The Pick
Jones was selected in the second round of the NFL Draft, at the 38th pick, by the Tampa Bay Buccaneers.
There is an obvious fit for “RoJo†with the Buccaneers, who moved on from long-time starter Doug Martin this offseason. Tampa Bay needed another impactful rusher in this backfield, with Peyton Barber (3.96 career yards per attempt), Charles Sims (3.91), and Jacquizz Rodgers (3.83) the only holdovers from last season. By our schedule-adjusted Net Expected Points (NEP) metric, Tampa Bay had the seventh-worst rushing attack in the league in 2017.
We can see the woes of the Bucs’ backfield clearly -- and why Tampa wanted to spend a top-40 pick on the position -- when we examine their individual production in terms of Rushing NEP per play and Reception NEP per play. The table below compares Barber, Sims, and Rodgers to the positional average from last year, organized by Rushing NEP per attempt. Success Rate is the percentage of plays that resulted in positive NEP.
| 2017 | Rushes | Rushing NEP Per Carry | Rushing Success Rate | Targets | Reception NEP Per Target | Reception Success Rate |
|---|---|---|---|---|---|---|
| Peyton Barber | 108 | 0.01 | 45.37% | 19 | 0.25 | 56.25% |
| Charles Sims | 21 | 0.01 | 38.10% | 47 | 0.17 | 62.86% |
| League Average | 74 | -0.05 | 38.08% | 23 | 0.34 | 61.87% |
| Jacquizz Rodgers | 64 | -0.07 | 37.50% | 11 | 0.35 | 77.78% |
While Barber was solid as a runner, Rodgers was pretty bad, and Sims wasn't used much in the ground game. In the passing game, only Rodgers was above the positional average in terms of Reception NEP per target.
We'll need to monitor the Bucs' backfield this summer, but the addition of Jones could mean that Barber will be the hammer back to Jones’s electric upside (the classic thunder-and-lightning approach), while Rodgers and Sims operate as receiving specialists. How the touches sift out from there remains to be seen, but on paper, this looks like it's much more likely to be a committee than a lead-back situation.
Jones now finds himself on a team with 138 vacated rushing attempts from the year prior, something that should benefit his immediate impact, but he is definitely a wild card when it comes to projecting his NFL future.


