


Daily Fantasy NASCAR: Quaker State 400 Track Preview


One of the unique challenges with daily fantasy NASCAR is that every track is different. Not only does this mean that certain drivers will perform better at one place than another, but each track will have different scoring tendencies than the previous one. That means we need to alter our strategies pretty drastically.
Each week here on numberFire, we're going to dig into the track that's hosting the upcoming weekend's race to see what all we need to know when we're setting our lineups. We'll have a separate piece that looks at drivers who have excelled there in the past; here, we just want to know about the track itself. Once qualifying has been completed, we'll also have a primer detailing which drivers fit this strategy and should be in your lineup for that week.
This week, the Monster Energy NASCAR Cup Series is heading to Kentucky for the Quaker State 400, its second consecutive Saturday night race. What can we learn from looking at past races at Kentucky from a DFS perspective? Let's check it out.
Track Overview
At first glance, Kentucky is going to look a lot like plenty of other races on the Monster Energy NASCAR Cup Series schedule. It's a 1.5-mile track and 400-mile race, giving us 267 laps of racing and 26.7 FanDuel points available for laps led. That's the exact same format as we had in Chicagoland two weeks ago and Kansas back in May. But there are some unique things to note about this track.
From a construction perspective, Kentucky is a bit different than most of the other 1.5-mile tracks on the circuit. The banking in the turns is 17 degrees in turns 1 and 2 and just 14 degrees in turns 3 and 4. Most other 1.5-mile tracks are closer to 20 degrees, meaning drivers who excel at other 1.5-mile tracks may not necessarily feast here. There is plenty of overlap, but the distinctions are still important.
When looking at how drivers have performed at similar tracks, you can still look broadly at 1.5-mile tracks. But the results may be more representative if you specifically zero in on Chicagoland, Kansas, and Las Vegas, the three 1.5-mile tracks that also have a tri-oval configuration and banking that is at least somewhat similar to Kentucky's.
We'll also have to be a bit cautious when looking at past history at the track. Kentucky was repaved prior to the 2016 race and -- essentially -- again prior to last year's running. This will change the dynamic of the track and potentially alter which drivers can run well here. When looking at course history at Kentucky, you can view races prior to that repaving, but you must put more weight on what the drivers have done here the past two seasons.
One thing that has been consistent throughout the time the Cup series has been at Kentucky, though, is that drivers can dominate here. In the past four races, there have been five drivers who have led at least 100 laps in a single race, good for a boost of at least 10 FanDuel points. Drivers have led at least 150 laps in three of those races. You need those drivers on your roster.
It will not be surprising to learn that most of these dominant performances come from the front of the pack. In our 4-race sample, no driver starting outside the top 9 spots has led more than 35 laps. Of the 9 drivers to lead at least 35 laps, 7 started on the front row. It is a major advantage to start either on the pole or second at this track, even more so than we see at other locations.
Thankfully, though, it's not as hard to predict who will lead those laps as it may seem. In last year's race, both Martin Truex Jr. and Kyle Busch topped the 100-laps led barrier. They were starting on the front row, had elite current form, and were among the five fastest cars in both practices. Practices -- which are scheduled to take place Friday afternoon -- will be a key to assembling good lineups this weekend.
We'll talk more about the balance in searching for laps led in the historic scoring trends section ahead. But before that, it's worth noting that drivers can make up ground here after starting in the back as long as their car will allow it.
In last year's race, Kyle Larson started dead last after pre-qualifying inspection issues prevented him from running a lap in the first round of qualifying. Larson was already up to third by the end of the first stage and finished the race in second. That's a huge day for DFS.
If a great car winds up -- for one reason or another -- buried in the back of the pack, they'll be able to get you some serious place-differential points. You'll have to ask how to balance that against seeking lap leaders, but they'll have the upside you need.
With this in mind, which starting positions have been most fruitful for FanDuel points historically at the track? Let's check that out and try to cement a strategy for roster construction this weekend.
Historic Scoring Trends
When looking at historic scoring trends at this track, we do need to keep the repaving in mind. This can sometimes change the way a track races, potentially limiting the number of grooves available for passing.
As such, let's break the scoring by starting position into two different groups: the past four races at Chicago overall and then the two races since the initial repave. When we look at the past four races, that will include two races in which the maximum number of cars was 43 as opposed to the current max of 40. As such, whenever a driver started or finished worse than 40th, their position was adjusted to be 40th to mesh with current scoring rules.
With that said, here's the FanDuel-point distribution based on starting position at the past four Kentucky races.
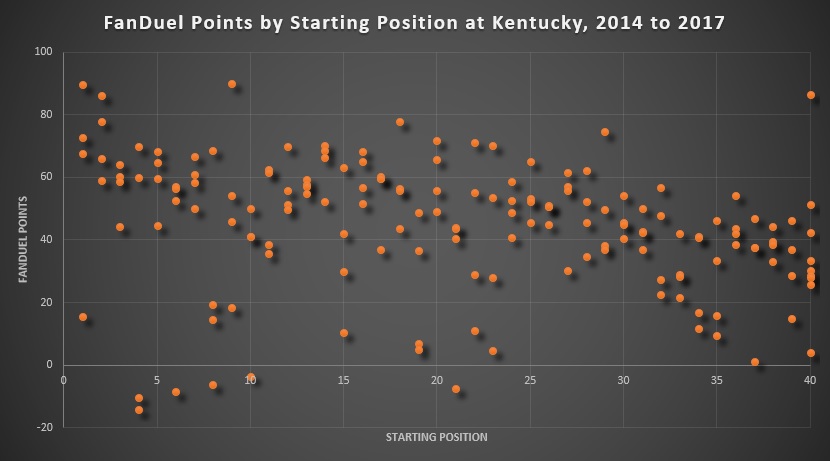
And here's that same chart, looking at just the past two races.

Drivers were able to dominate from the front both before and after the repave. So that part's still in place.
Additionally, of the 13 drivers to score at least 70 FanDuel points in this 4-race sample, 7 did so after starting outside the top 10. Four of those non-top-10 starters came from the two most recent races, and the other three were before that. It doesn't seem as if the repave changed things too drastically from a scoring perspective, meaning we can just take these four races together without too many caveats.
What is noteworthy from the first graph is the gap between the highest-scoring drivers and the rest. In our four-race sample, four drivers scored at least 86 FanDuel points. No other drivers had more than 77.8. That's almost a 10-point gap in scoring before things flatten out. If you don't have that high-upside driver from that specific race, your lineups will be left behind.
Not shockingly, most of those crazy high scorers came from the front. Three of them led at least 150 laps, and two started on the front row. Kyle Busch led 163 laps from 9th place in 2015, and Kyle Larson scored 86.4 points from 40th place last year. This has pretty big implications.
As mentioned before, no driver in this four-race sample has started worse than ninth and managed to lead more than 35 laps. When Kyle Busch started 18th, led 31 laps, and finished second, he scored 77.8 points. That's good, but it's not moving the needle as much as the other examples on the board.
If one of the top drivers winds up starting in the middle of the pack, their upside takes a hit. They're not going to have the same place-differential potential as Larson had last year, and they're not going to have the laps-led upside of someone starting up front. This may be a bit of a no-man's land for high-cost drivers.
If one of the current-form studs manages to start up front, we should consider using him because he will have lap-led potential. If he starts way in the back, he'll be a lock for cash games and carry plenty of upside for tournaments.
But if he starts in the middle of the pack, we may want to look elsewhere in tournaments. He'll still be a good play for cash as he should churn out a good finish, but he won't possess the same ceiling as drivers starting at one of the extremes. You don't have to fade him if there are no dominant drivers at the front, but it will certainly be a viable strategy.
That settles the top end of the scoring spectrum. Next, we should shift our focus to the second-tier scorers to know which positions we should target in order to round out our lineups.
In our 4-race sample, there have been 25 drivers (roughly 6 per race) who have scored at least 65 FanDuel points. Here are the starting ranges for those drivers.
| Starting Position | Drivers to Score 65+ FD Points |
|---|---|
| 1st to 5th | 8 |
| 6th to 10th | 3 |
| 11th to 15th | 4 |
| 16th to 20th | 5 |
| 21st to 25th | 3 |
| 26th to 30th | 1 |
| 31st to 35th | 0 |
| 36th to 40th | 1 |
Although a lot of these performances came from up front, drivers with place-differential potential in 11th through 25th still often found themselves scoring a good chunk of points.
This gives us a pretty clear picture of how we should be assembling our rosters. After we get our lap leaders at the front of the pack, we want to go for place-differential drivers who can log a top-10 finish. This means our mid-tier drivers in salary should likely come from this range, starting 16th through 25th and capable of picking up some spots for the finish. Easy enough.
The one lingering question here is what balance we should strike between finding lap leaders and drivers with place-differential upside. Let's try to tackle that here.
We can get a glimpse of this by looking back at these past four races and seeing which five drivers scored the most points in each. This is basically what a "perfect" lineup would look like if we didn't have to worry about a salary cap. If these "perfect" lineups were to have just one driver starting in the top 10, we'd know that we would likely need to lean that direction before filling in with place-differential candidates after that.
Here's a list of those "perfect" combos from the past four races at Kentucky. The "1st" column represents the starting position of the driver who scored the most FanDuel points in that year's race, and so on.
| Year | 1st | 2nd | 3rd | 4th | 5th |
|---|---|---|---|---|---|
| 2017 | 40 | 2 | 1 | 12 | 14 |
| 2016 | 8 | 2 | 22 | 14 | 23 |
| 2015 | 9 | 20 | 4 | 8 | 16 |
| 2014 | 1 | 18 | 29 | 14 | 7 |
Every single "perfect" lineup had at least two drivers who started in the top 10. The 2015 race had three such drivers. Then the place-differential guys filled in after that.
This is our blueprint for filling out lineups. As long as qualifying allows us, we should likely have two top-end drivers who are capable of leading laps and snagging a win in each lineup. These drivers should be starting on or near the front row if possible, but those in the back half of the top 10 are in play, too, if they are fast in practice.
After we get those two studs, we look to the middle tier of pricing and try to find drivers starting 11th or worse who can snag a solid finish. The further back they start, the better as long as their cars are good enough to make up ground. But assuming nothing goes awry in qualifying, those are most likely going to be the most fruitful zones.
If you decide to go with a driver priced in the $6,000 range in order to pay up a bit more, you'll want them starting as deep as possible. Trevor Bayne scored 62.2 FanDuel points in 2015 after starting 28th and finishing 13th, and Marcos Ambrose had a similar output in 2014. Michael Annett started 32nd, finished 18th, and scored 56.7 points in 2014. Their upside will be lower than the drivers in the pricing tier just above them, so we should try to avoid the true punts if we can, but you want them starting deep if you are forced into this region.
As always, it is important to be flexible based on what happens in qualifying. If qualifying gets weird and a bunch of mid-tier drivers start at the front, then we may need to change up our approach and avoid that part of the field. That seems unlikely given history, though, meaning the most likely scenario is that we get our two studs and then look for place-differential upside where we can find it.


