


Jeff Samardzija Is Primed for a Bounce-Back Season in 2016


While Jeff Samardzija's 2015 was a big disappointment, not everyone is worried about it.
I’m not particularly worried about it, but more importantly, neither is the San Francisco front office.
Despite allowing more hits than any pitcher in the Majors and a 4.96 ERA, the Giants gave the 31-year-old a five-year, $90 million contract over the offseason. If we value a win above replacement at $7 million, the Giants are expecting him to deliver about 2.6 WAR per season.
In terms of rWAR, which is based around actual runs allowed, he was roughly replacement level. rWAR, though, doesn't take into account sequencing luck, to the detriment of Samardzija, who had an unsustainably low 67.2% Stand Rate.
fWAR instead uses Fielding Independent Pitching, stripping out factors like Strand Rate and Batting Average on Balls in Play (BABIP), and here, Samardzija was worth 2.7 WAR.
Samardzija himself is not blameless for his poor results, though, as his strikeout and groundball percentages both fell to the second lowest rates of his career. Still, after adjusting for league and ball park, he provided 214 innings of league-average FIP.
If he can reverse the strikeout and walk trends, he will be worth what San Francisco is paying him.
The Strand Rate Monster
While he was far from his best, Samardzija got hammered by sequencing misfortune.
As mentioned, his Strand Rate was below the MLB average of 72.9%, and this is generally something individual pitchers do not have control over. Certain pitchers can be better or worse in this regard, but Samardzija had a Strand Rate that ranged between 71.7% and 73.2% in his previous three seasons as a starter.
This truly is the biggest factor explaining the 20% gap between his park-adjusted ERA and park-adjusted FIP. While Samardzija did allow the most hits in baseball, he also threw the fifth most innings in the game. His WHIP of 1.29 was equal to the league average, while his .332 wOBA allowed was not significantly worse than the American League average of .317 (not 20% worse, anyway).
According Baseball Prospectus’ Deserved Run Average, which is quite likely the best backwards-looking run estimator we have, Samardzija “should have†allowed an ERA that was about league average.
DRA is measured on a per plate appearance basis, rather than a per inning one like ERA or Runs Allowed Per Nine, and uses linear weights to measure the run value of each individual plate appearance (it also adjusts for a multitude of contextual factors, but these turned out to be a net-positive for Samardzija; the White Sox defense stunk, but he benefited from good catcher framing and pitching in pitcher-friendly stadiums).
Throw Your Sinker More!
There were some factors behind Samardzija’s struggles in 2015 that went beyond random variation. It was still his worst year as a starter, and while it wasn’t 4.96 ERA-level bad, he did compile his lowest career FIP, xFIP, DRA and cFIP (contextualized FIP, the most predictive defense-independent pitching stat at our disposal; all four numbers were around average after park and league adjustments, but he had been an above-average pitcher).
His 5.4% walk rate was below both his career average and the AL average (7.8% and 7.6%, respectively), but his strikeout rate plummeted to 17.9% (the league average was 20.1%).
Samardzija had posted a strikeout rate of at least 23.0% in his previous three seasons as a starter. He continued to throw strikes, posting a better strike per pitch rate (67.1%) than his rate over the previous three years (64.8%), according to Baseball-Reference, but he missed bats at a much lower rate.
His swinging strike per strike rate (a good estimator of future strikeouts) dropped from 19.1% in 2012 to 2014 to 16.3% last season (the league average was 16.7%).
Samardzija’s swinging strike per pitch rate, though, was 9.8% and identical to the AL average, so there may have been (more) sequencing trouble here.
He also allowed 1.2 home runs per nine innings, which tied for the 11th-highest rate in the majors, despite a home run run per flyball rate of 10.8% that was slightly better than the AL average of 11.3%.
The obvious reason is the aforementioned huge uptick in flyballs, as Samardzija's 39.0% groundball rate was the 13th-lowest in MLB.
While his strikeout problems are harder to explain, the decline in grounders is an easy one to figure out, and can be chalked up to a decline in sinker usage.
From 2012 to 2014, Samardzija threw his sinker 27.2% of the time, making it his most frequent pitch, according to Brooks Baseball. During this span, the sinker generated a 58.9% groundball rate, while his cutter generated a rate of just 32.4%.
Last year, though, his sinker usage rate declined to about 22.0%, corresponding with an uptick in cutter rate, as you can see below.
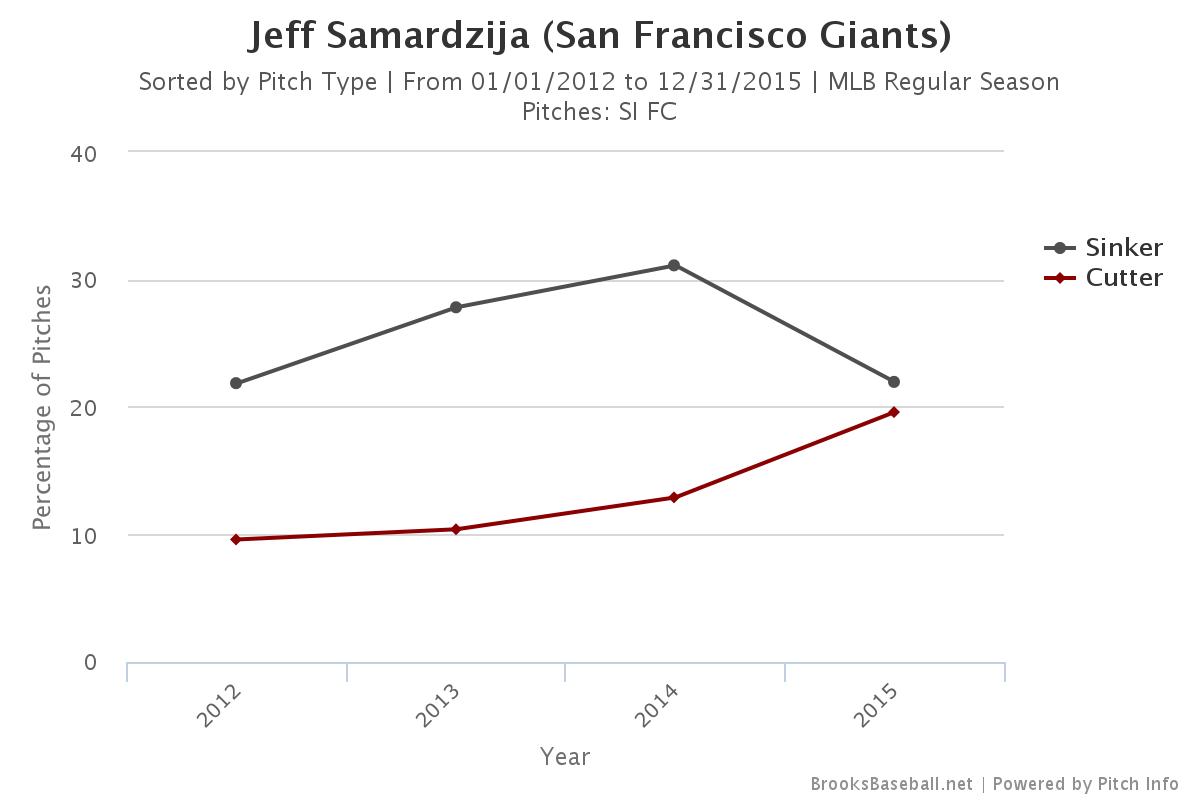
The slider still generated a healthy 53.0% groundball rate, but it was not enough to compensate for the increased frequency of cutters, which had just a 26.7% groundball rate in 2015.
For whatever it’s worth, in his only exhibition outing so far this season, he threw 25 sinkers (34.3% of his pitches), compared to 11 cutters (15.1%). For his sake and the Giants’, hopefully this Spring Training appearance is a sign of things to come.
The Projections
The various projection models are in agreement that Samardzija is headed for a bounce-back season. While he's on the wrong side of 30, his Strand Rate almost surely will not be below 70% again, and he has over 600 innings worth of data suggesting he is an above average starter.
Here is what these systems forecast, including our own.
| Player | IP | K% | BB% | ERA | WHIP | FIP | WAR |
| numberFire | 198.1 | 20.60% | 6.00% | 3.86 | 1.26 | --- | --- |
| Steamer | 195 | 20.20% | 5.50% | 3.38 | 1.17 | 3.5 | 2.8 |
| ZiPS | 196 | 22.20% | 5.40% | 3.31 | 1.14 | 3.17 | 3.7 |
We aren't as bullish as the other two models, as unlike the other two models (and PECOTA at Baseball Reference, which has Samardzija allowing a 3.35 ERA), we have him forecasted to allow more than one home run per nine innings.
If he can return to his previous rates of sinker usage and get his groundball rate back down, though, it is easy to see him beat this projection and have a nice rebound year.


