


Are Schilling and Mussina Comparable to Other Baseball Hall of Famers?


In his first year on the Hall of Fame ballot (2013), Curt Schilling received 38.8% of the vote. In 2014, when Greg Maddux and Tom Glavine received 97.2% and 91.9% of votes, respectively, Schilling received 29.2%.
However, in the most recent voting, Schilling bounced back to 39.2%, still quite shy of the 75% needed for entry, while pitching legends Randy Johnson, Pedro Martinez, and John Smoltz were all elected.
Meanwhile, when Mike Mussina was placed on the Hall of Fame ballot for the first time in 2014, he received 20.3% of the vote and then jumped to 24.6% the subsequent year.
For those who watched Mussina pitch so well for so long, and who saw Schilling dominate batters for years, a question presents itself: Can we not place these two pitchers in the same category as Maddux, Glavine, Johnson, Pedro, and Smoltz? Apparently, Hall of Fame voters are currently reluctant to do so.
To answer this question, let’s compare Schilling and Mussina to other starting pitchers during their primes. Let’s assume that this period was about 1995-2004 -- this was also the primary decade in which Maddux, Glavine, Johnson, Pedro, and Smoltz were also having success (which makes sense, since these players were placed on the Hall of Fame ballot at around the same time).
We'll consider career data from starters of this time period who racked up at least 1,500 innings pitched (to make sure we aren’t clouding our data with irrelevant players who may have only started a couple games). Because we're only considering starters and Smoltz spent four of those seasons as a reliever, we'll leave him out.
If we’re going to compare Schilling and Mussina to other players, however, we need a means of comparison. We’d like to consider the different attributes of a pitcher’s performance that are generally unrelated to each other -- in other words, uncorrelated. For instance, we wouldn't want to include both FIP and WAR in our model since these two statistics are so closely related. For all the starters with at least 1,500 innings pitched from 1995-2004, of which there are 36, we can examine the correlation matrix of various pitching statistics and choose some combination of stats that are relatively uncorrelated. In particular, five statistics provide us with a lot of information while not being tremendously correlated with one another. Below, you can view the correlation matrix for K/9, BB/9, HR/9, RA9-WAR, and CG:
| K/9 | BB/9 | HR/9 | RA9-WAR | CG | |
|---|---|---|---|---|---|
| K/9 | 1.000 | 0.028 | -0.346 | 0.595 | 0.527 |
| BB/9 | 0.028 | 1.000 | -0.057 | -0.428 | -0.509 |
| HR/9 | -0.346 | -0.057 | 1.000 | -0.572 | -0.270 |
| RA9-WAR | 0.595 | -0.428 | -0.572 | 1.000 | 0.746 |
| CG | 0.527 | -0.509 | -0.270 | 0.746 | 1.000 |
The main components of FIP, namely strikeout, home run, and walk rates, are not particularly correlated amongst our 36 starters. Among these three rate statistics, the correlation of greatest magnitude is between home run rate and strikeout rate, at -0.346, which is still not very strong.
The correlation between RA9-WAR and CG is .746, a little higher than we'd like, but RA9-WAR tends to match up better with these other statistics than regular WAR. Because adding any more statistics would probably be extraneous and wouldn't provide us with more information, we'll stick with these five.
For an idea of how Schilling and Mussina compare to their Hall of Fame counterparts in these five categories, here's how some other notable pitchers performed during our time period of interest:
| Name | K/9 | BB/9 | HR/9 | RA9-WAR | CG |
|---|---|---|---|---|---|
| Curt Schilling | 9.5 | 1.79 | 0.99 | 61.6 | 64 |
| Mike Mussina | 7.75 | 2.01 | 0.99 | 50.7 | 38 |
| Pedro Martinez | 10.53 | 2.26 | 0.7 | 73.7 | 41 |
| Randy Johnson | 11.95 | 2.61 | 0.83 | 72.7 | 57 |
| Greg Maddux | 6.45 | 1.32 | 0.67 | 68.6 | 45 |
| Tom Glavine | 5.44 | 3.1 | 0.75 | 53.5 | 23 |
| Roger Clemens | 9.07 | 3.29 | 0.75 | 56 | 23 |
Now, let's proceed to group starters together based on their performance in our five categories. To do this, we'll use a clustering algorithm called complete-linkage hierarchical clustering. All this does is recursively cluster together pitchers who are related on our chosen attributes (K/9, BB/9, etc.). More specifically, a distance matrix is formed containing measures of similarity between our players. At first, each player is his own cluster, until each subsequent step, when the two clusters closest together are clustered together themselves. By the end of it, we'll have a way of associating Schilling and Mussina with other, similar pitchers.
Sure enough, the algorithm gives us this.
It should be noted that the order of the clusters isn’t any notable scale of talent. If it was, Clemens and Glavine would obviously be above Woody Williams and Kevin Appier. This method simply clusters players together based on similarities in attributes, determined by a distance matrix.
We see that the algorithm creates three higher level clusters. Our first cluster contains Pedro, Maddux, Johnson, and Schilling. All of those players were voted into the Hall of Fame on the first ballot except Schilling.
The next cluster, with guys like Kirk Rueter and Tim Wakefield, is full of starters who had solid careers but are obviously not Hall of Fame bound.
The third cluster is more interesting. We have pitchers with careers noted for their longevity, like Jamie Moyer and Kenny Rogers, while we also have dominant pitchers of the decade, like Clemens, Glavine, and Mussina. If we examine the sub-clusters, we find that four players in particular are grouped together, namely Tom Glavine, Roger Clemens, Kevin Brown, and Mike Mussina.
Of those four starters, one was elected to the Hall of Fame on the first ballot (Glavine), one would surely be elected to the Hall of Fame if it weren’t for alleged steroid use (Clemens), and another would also warrant serious consideration if he wasn’t dismissed for alleged steroid use and his association with one of the most unpopular pitching contracts in history (Brown, whose 73.5 career WAR is greater than Tom Glavine’s 64.3 and ranks 26th all-time).
So, can we associate Schilling and Mussina with their peers who gained entry to Cooperstown while these two men are trying to break 40% of the vote?
Well, it’s actually only logical to do so. Based on pure performance, both Schilling and Mussina are closely related with other Hall of Famers of the same period.
If someone voted for Pedro, Maddux, and Johnson because of their memorable dominance over a long stretch of time, then they probably should have also voted for Schilling. If someone voted for Glavine and would have voted for Clemens if the steroids weren’t a factor (and let’s face it, they would have), then they should have voted for Mussina as well.
If you still refuse to give Hall of Fame credit to Mussina and Schilling, we can imagine all of this data visually using multidimensional scaling:
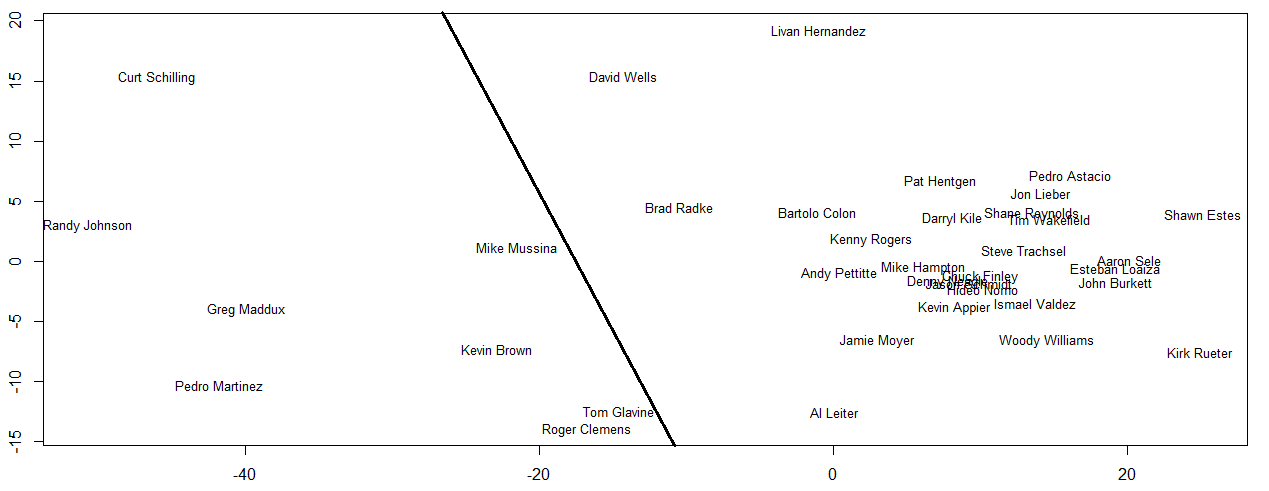
This plot is a two dimensional representation of the similarity between our pitchers on our five chosen attributes. Players closer together are more similar, and players farther away from each other are more dissimilar. Several of the players to the right are packed densely close together. While they had good careers, they probably wouldn't grab our attention for Hall of Fame consideration. Just based on their career numbers, the players on the left should be in the Hall of Fame.
So where’s the line, then, between a Hall of Famer and someone who doesn’t quite cut it? Well, I drew it. And you can see who made the cut.


