


The 3 Types of NFL Running Backs Based on Workloads


Ask any NFL running back and he'll tell you to feed him the ball. He'll tell you that in order to succeed he needs a consistent and heavy workload to build up momentum and break down his opponents to make the big play.
But if you talk to any NFL coach, what he'll more than likely tell you is that running backs operate best when their touches are shared across a committee, and that by limiting their reps, players can stay fresh for the end of the game.
So the question becomes, which one of these is right?
To answer this question, I tracked the yards-per-carry between rush attempts 1 to 10 versus attempts 11 to 20, and (for those backs with greater than 10% of their carries in this range) attempts 21 and up for all 32 current lead backs in the NFL.
This analysis produced some interesting results, shown below.

Carlos Hyde and Devonta Freeman failed to register sufficient carries in the 11-20 rush attempt range (>10%) to qualify for this study.
Despite the fact that the average yards-per-carry for these running backs as a whole registered in at a stable 4.3 yards-per-carry over each range of rush attempts, these running backs clustered into three groups when broken up into individual players.

Group one comprised of backs who got stronger as their workload increased, demonstrating a greater than 10% increase in yards-per-carry from rush attempts 11 to 20 (or in some cases, like Le'Veon Bell, in rush attempts 21 and up), versus their first 10 attempts.
Group two comprised of tailbacks that maintained their yards-per-carry throughout the game, with their yards-per-carry from attempts 11 to 20 and 21 and up staying within 10% of their first 10 carries.
And finally, group three comprised of tailbacks that started off hot but fizzled out quickly, with their yards-per-carry dropping by more than 10% in rush attempts 11 to 20 versus their first 10 rushes.
Not surprisingly, as I'll describe in greater detail below, these trends correlate not just with our Net Expected Points (NEP) metric (which in short is an advanced metric that measures a player's contributions to a team's chances of scoring) but also influences how coaches manage the roles and touches given to these tail backs.
Group One: The Rising Stars
Group one running backs contain players that are not only capable of heavy workloads but flourish as a result of it. Indeed, this group includes some of the more impressive workhorse backs in 2014 including Jamaal Charles and Le'Veon Bell.
To better demonstrate this let's use Lamar Miller as an example. In 2013 Miller shared the backfield with Daniel Thomas, recording just 177 carries over 16 games. Yet when looking at his yards-per-carry splits from his first 10 rush attempts versus attempts 11 to 20 we see that his yards-per-carry followed a similar upward trend as our group one backs.

And indeed when Miller was given a bigger opportunity to showcase his talents -- with an increase in carries from 177 in 2013 to 216 in 2014 -- he responded with career highs in rushing yards (1,099), rushing touchdowns (8), and Rushing NEP (13.69).
This ability to get stronger and wear down opposing defenses as the game progresses has a direct impact on productivity, as this group also averaged the highest Rushing NEP of the three at 10.48.
It's therefore clear that when it comes to which halfbacks deserve bell-cow status, members of this group are prime candidates because they have demonstrated an ability to excel with increasing workloads.
Group Two: The Steady Workhorses
Group two consists of running backs whose yards-per-carry remain stable throughout the game. This consistency puts the minds of NFL offensive coordinators at ease in situations where a heavy dose of the run game is called and therefore it should not come as a surprise that many players in this group are considered workhorse backs in the NFL, including DeMarco Murray and Adrian Peterson.
Indeed, because of this reliability, members of this group were afforded the greatest workload of the three, averaging 254 carries each in 2014. And in part due to this predictable production, these backs average a decent, if not modest -1.94 Rushing NEP, placing them right in the middle of the three groups in this metric.
It should be noted that a negative Rushing NEP is not wholly indicative of struggling production. Running the ball is inefficient compared to throwing the ball, and only 11 of the 43 running backs who carried the ball 100 times or more posted a positive Rushing NEP in 2014.
Group Three: The Running Backs by Committee
Group three comprises of players that are perhaps best relegated to committee-back status. These backs lose their effectiveness as the workload piles on, demonstrating substantial drops in yards-per-carry beyond their initial 10 rush attempts. This ineffectiveness late in the game also correlates with a reduced ability to contribute to team success as measured by Rushing NEP, with this group averaging the lowest value of the three groups in this metric at -4.80.
This group includes players that have had difficulty seizing the backfield to themselves -- such as Isaiah Crowell in Cleveland, Doug Martin in Tampa Bay, and Bishop Sankey in Tennessee -- and these numbers seem to provide a reason as to why.
Running backs in group three produce quickly diminishing returns with increasing playing time and therefore must often have their workloads managed in order to maintain their effectiveness throughout a game.
There is no better example of this than Arizona Cardinals running back Andre Ellington. After bursting onto the scene as a rookie with a sterling 5.5 yards-per-carry average, he had fans clamoring for more touches for their young tailback by midseason. After the retirement of fellow backfield-mate Rashard Mendenhall, the coaching staff obliged by handing the keys to the running game to their second-year back. And how did Ellington respond? By posting an abysmal 3.3 yards-per-carry on the season and landing on the injured reserve list by Week 14.
While Ellington flashed a promising rookie year, we can see that by looking at his yards-per-carry splits, the warning signs of a breakdown with an increase in workload were already there.
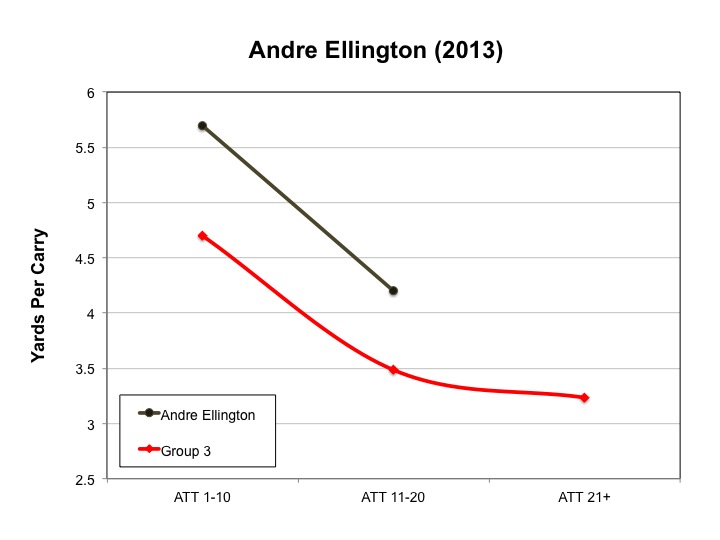
Similar to other running backs in group three, Ellington showed a sharp decline in effectiveness when comparing his yards per carry in his first 10 touches compared to his next 10, suggesting an increase in workload may not have been an ideal situation for him.
And because of these issues, it should therefore not come as a surprise that Arizona has been linked to rumors regarding their desire to acquire another back to pair alongside Ellington in the backfield, including a possible trade for Adrian Peterson and interest in early-round tailback options in this year's draft.
To iterate this point about group three tailbacks further, if we look at the running backs that were handed lead back status prior to the start of the 2014 season who then went on to lose significant touches to their backfield mates by midseason, we see a similar trend in their yards-per-carry splits in 2013 as we saw with Ellington.

These players -- most notably Montee Ball, C.J. Spiller, and Ben Tate -- all demonstrated an inability to maintain their efficiency in the run game as the carries piled on and, as a result, opened the door for players behind them on the depth chart to steal away their touches in the ground game.
Conclusions
From this study I think you can appreciate that, for running backs, more isn't always better. Some players thrive under the pressure of a heavier workload, only getting better as the game progresses and opposing defenses wear down. Other tailbacks find difficulty in maintaining the same level of play throughout the game as the demands of the position take their toll on them.
And as any NFL head coach will tell you, identifying which players fall into each category isn't always easy.
But by tracking the trends above and seeing which players are able to maintain (or even increase) their efficiency with rising workloads and which ones fade, we can identify the tailbacks deserving and capable of operating as workhorse backs and those who should remain in committee-style backfields.


