


Dynasty Fantasy Football: You're Probably Overvaluing Your Rookie Draft Picks


Teams can't beat the NFL Draft.
That, at least, was what Neil Paine showed -- and concluded -- in a study done on FiveThirtyEight.com a few years ago.
Fantasy football owners can't beat the draft, either.
Most of America plays in fantasy football redraft leagues, but the true fake football degenerates participate in dynasty leagues, where you keep the same team year over year. There's no typical draft in August where the entire player pool is up for grabs. Instead, there's usually a rookie draft each season where teams add first-year players -- and only first-year players -- to their squad while dumping worthless veteran assets.
Saquon Barkley, for instance, is the consensus, obvious first-overall selection in rookie drafts this season. Teams owning that top pick should -- and I stress the word should -- have a surefire stud in fantasy football for years to come.
But exactly how valuable is that pick?
Probably not as valuable as you'd think.
We Think We Know More Than We Do
We don't always get a slam-dunk top fantasy football rookie selection like Saquon Barkley. Last year, plenty of owners debated whether to draft Leonard Fournette or Christian McCaffrey with a top rookie pick. Back in 2015, folks had to carefully choose between Todd Gurley and Amari Cooper.
Perhaps that's the reason top overall rookie picks haven't always panned out for fantasy owners. But, then again, the first running back or wide receiver drafted in an actual NFL Draft isn't bust proof, either.
Things aren't flawless for fantasy owners who participate in rookie-only drafts. They -- we -- get things wrong all of the time. And thanks to MyFantasyLeague.com's average draft position (ADP) data, we can see exactly how wrong we are at projecting the fantasy football careers of these offensive players.
Just to peek at things from a bird's-eye view, take a look at the chart below that shows a player's average draft position in a rookie draft (so "1" would be first overall, "2" would be second overall, and so on) among running backs selected in the top-48 (top four rounds in a 12-team league) over the last nine years versus their points per game (PPR format) during the first three seasons of their career. If a player hasn't played a full three years -- like Kareem Hunt or Alvin Kamara -- then their career points per game is used.
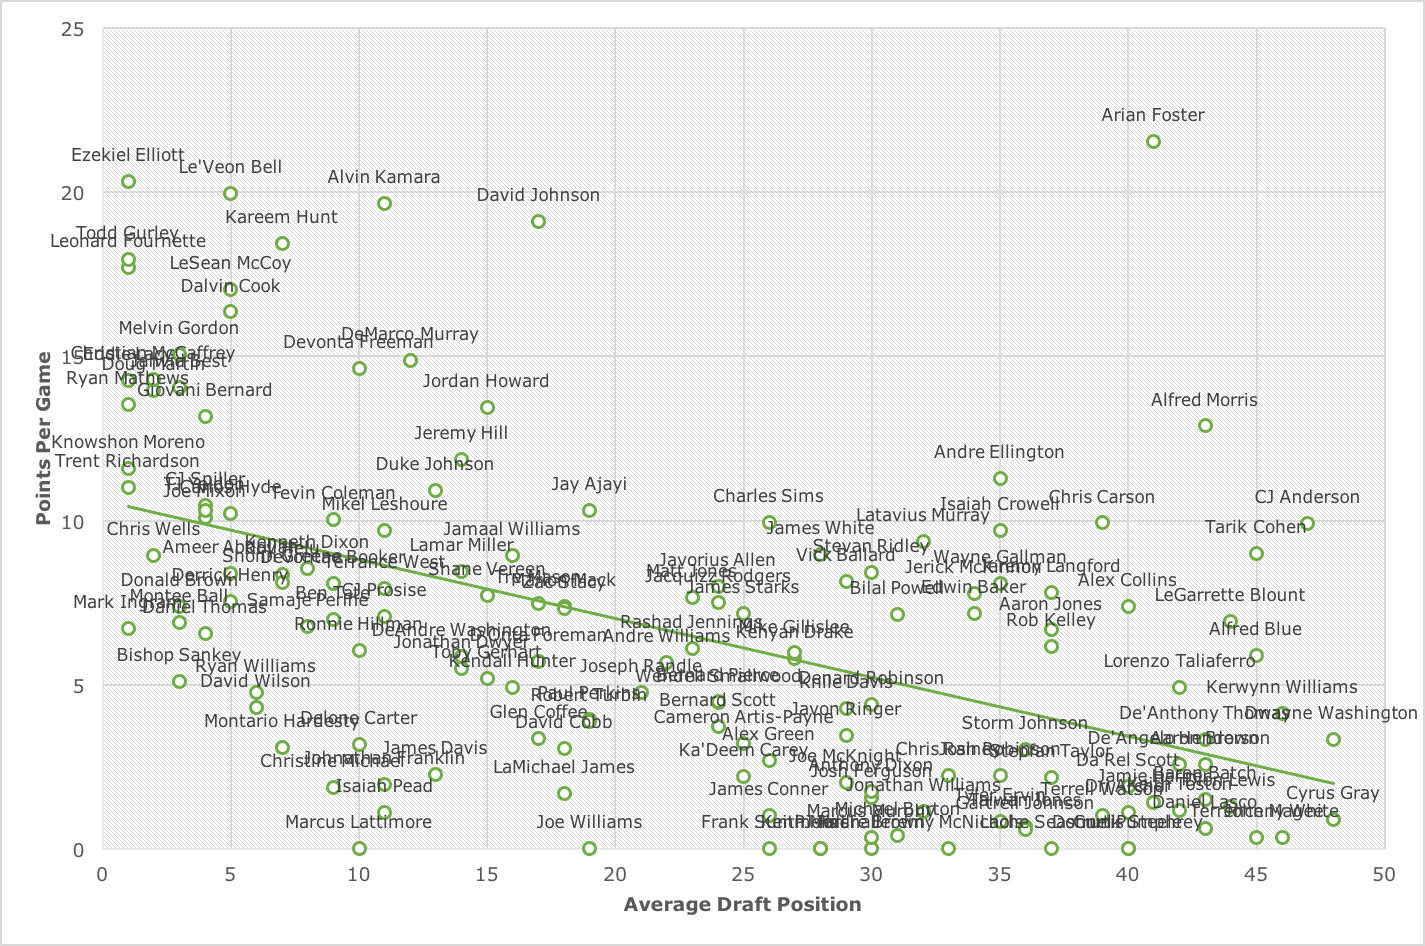
The trendline represents the expected points per game at a particular average draft position, so anyone above the line has outperformed expectation, while anyone below has underperformed. And the downward slope is a good thing -- we would expect a later draft selection to see a lower points per game output.
But some of the names on the scatterplot will also make you cringe. Marcus Lattimore as a first-round rookie pick? Bishop Sankey as a top-five one? Ryan Williams? Montario Hardesty?
We get things wrong. And we get things wrong often.
Here's the same chart, but for wide receivers:
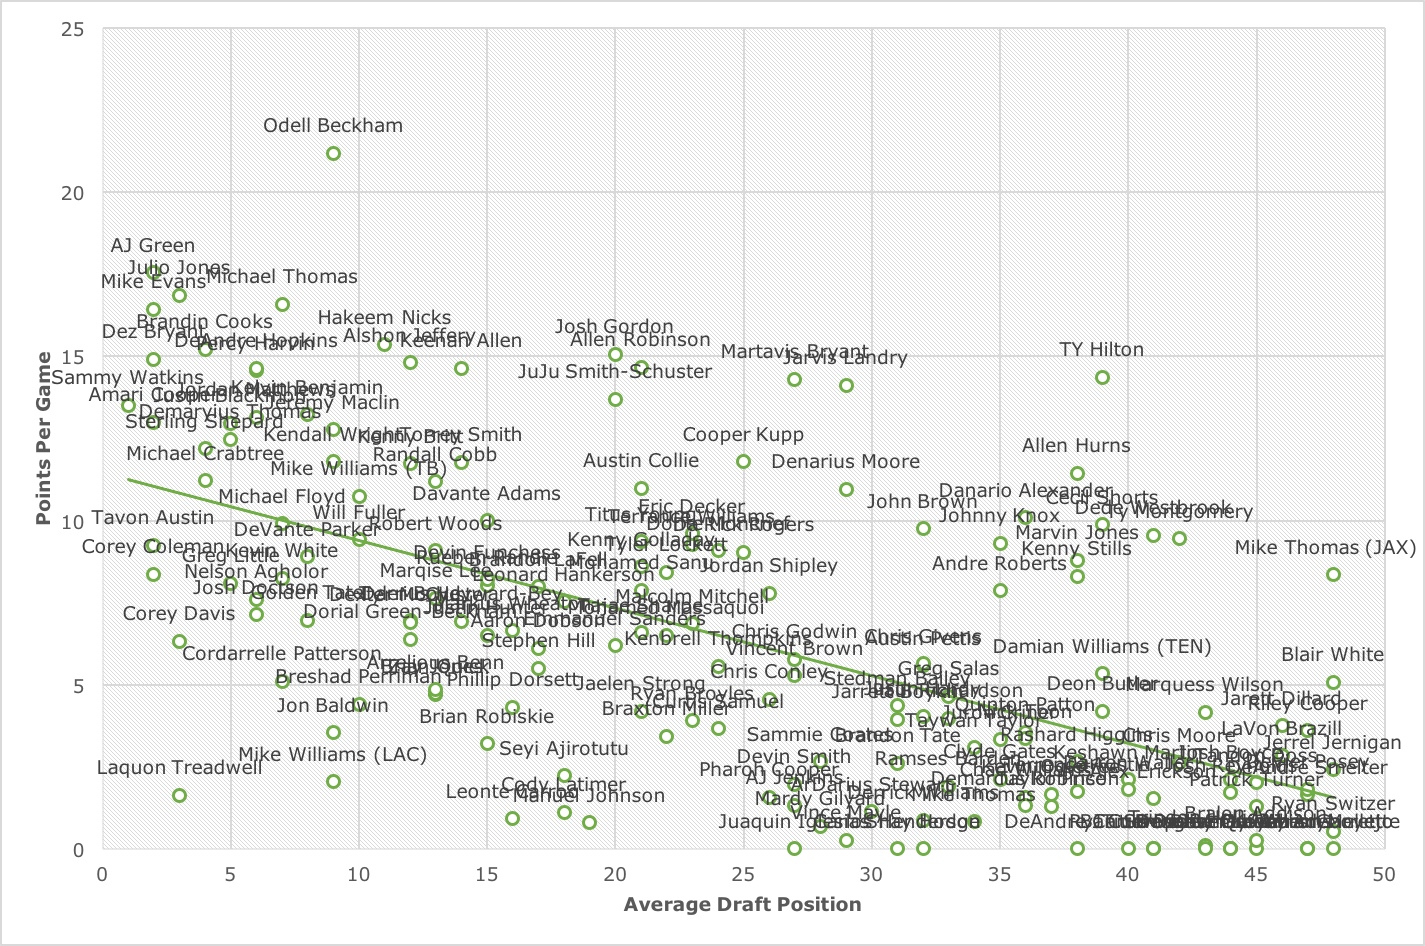
Again, we've got a trendline moving in the right direction, but things aren't ideal. Laquon Treadwell hasn't panned out. Jonathan Baldwin was a bust. Cordarrelle Patterson has been one, too.
The running back dataset produced an r-squared value of 0.25, while the wide receiver set came in at 0.35. For people who don't really care about the math side of things, those numbers aren't amazingly strong. And not only that, but the r-squared numbers drop when taking out the tail-end of the data, as most of the picks in the late-third and early-fourth rounds of these drafts end up barely producing at all.
Quantifying the Picks
Unfortunately, the dataset isn't large enough to simply equate a points per game value to each draft slot. There's only been one top overall pick that's been a wide receiver over the last nine years, for example. The trendline gives us an idea of what to expect, but like I just mentioned, it's not going to tell us everything since things can be skewed by the dataset's range. In other words, if we just looked at top-24 players instead of top-48 ones, we'd have a much different looking trendline.
And to be clear, being super exact with a study like this one isn't all that necessary. It's also not possible because there are so many ways to measure a player's overall success. In the graphs above, we're looking at how a player performed across the first three years of his career. Perhaps longevity matters more to you, and you'd rather look at games played. Or maybe you're more concerned with points per game across an entire career.
So, I guess the first thing we should discuss here is why I chose to look at the first three years of a player's career.
The way we view players changes all the time, and a rookie draft is the overall consensus perception of players at the start of their NFL careers. Then, after Year 1, things may shift. And the thought was that, after Year 3, we'd generally get an idea of the type of player we're working with.
Not only that, but when we're looking to trade rookie picks for already-established assets, we're doing so with the mentality that the newly acquired player will help us immediately. If, for example, you were looking to trade the third overall spot in a rookie draft for some 27-year-old running back, using a three-year window would give you a general idea of the type of points per game production you're forgoing by making the deal. If the 27-year-old running back's three-year projection looks to be far superior, and if you're looking to win now, maybe you do the deal.
Running Backs
Let's kick things off, then, with running backs. To reiterate, our sample size isn't large enough to look at average points per game at each draft slot. So, instead, let's take a look at points per game at different draft groupings: the front-end of the first round (picks 1 through 6), the back-end of the first round (picks 7 through 12), the front-end of the second round (picks 13 through 18), and so on.
| Count | Total Games | Points | Points Per Game | |
|---|---|---|---|---|
| Front Round 1 | 29 | 927 | 10,912.7 | 11.77 |
| Back Round 1 | 21 | 546 | 4,590.2 | 8.41 |
| Front Round 2 | 19 | 524 | 4,374.6 | 8.35 |
| Back Round 2 | 13 | 432 | 2,536.2 | 5.87 |
| Front Round 3 | 22 | 554 | 2,513.2 | 4.54 |
| Back Round 3 | 16 | 377 | 2,048.1 | 5.43 |
| Front Round 4 | 17 | 275 | 1,674.2 | 6.09 |
| Back Round 4 | 15 | 386 | 2,061.5 | 5.34 |
What we're seeing here is that 29 running backs have been selected as top-six picks in rookie drafts over the last nine seasons, and those guys have played in 927 games while averaging 11.77 PPR points per game. This should immediately raise some eyebrows, because 11.77 points per contest isn't all that impressive. Among backs who played at least 10 games last season, 18 had a higher points per game average than 11.77. To put this another way, the three-year average for a random running back selected in the top-six of a rookie draft yields RB2 results in PPR leagues.
Naturally, a back selected first overall will have more success than one who's selected, say, fourth.
For the most part.
Within the sample, eight backs were taken first overall. The only number-one rookie draft selection that wasn't a running back over the last nine years was Sammy Watkins. Of those eight running backs, the three-year points per game average has been 13.59. So you could strongly argue that the consensus top selection is significantly more fruitful than others selected in the top half of the draft.
And since we've got smaller samples when looking at this data by pick, I should note that the six backs selected fifth overall -- Dalvin Cook, Derrick Henry, Carlos Hyde, LeSean McCoy, Le'Veon Bell, and Ameer Abdullah -- have a three-year points per game average of 13.14. The three backs with a second-overall average draft position -- Doug Martin, Christian McCaffrey, and Beanie Wells -- have a three-year average of 11.66.
This is why we're grouping players here, but this also paints a picture that shows inaccurate projections.
Jumping back to the table displaying three-year averages, you can see the fairly dramatic dip in points per game once the first round and a half is over, and how the difference in expected points per game isn't all that dramatic during the back half of Round 1 and the front half of Round 2. Then things get dicey.
Of course, data that includes the first three years of a player's career also includes that player's first year. And the first season for any NFLer more than likely won't be his best one.
So let's split things up by Year 1, Year 2, and Year 3.
| Draft Spot | Yr 1 Games | Yr 1 PPG | Yr 2 Games | Yr 2 PPG | Yr 3 Games | Yr 3 PPG |
|---|---|---|---|---|---|---|
| Front Round 1 | 395 | 11.21 | 293 | 12.16 | 239 | 12.23 |
| Back Round 1 | 233 | 7.63 | 170 | 8.28 | 143 | 9.82 |
| Front Round 2 | 224 | 8.19 | 188 | 8.17 | 112 | 8.96 |
| Back Round 2 | 171 | 5.39 | 158 | 5.63 | 103 | 7.04 |
| Front Round 3 | 202 | 2.81 | 194 | 6.46 | 158 | 4.39 |
| Back Round 3 | 149 | 4.09 | 120 | 5.43 | 108 | 7.29 |
| Front Round 4 | 139 | 3.69 | 84 | 9.50 | 52 | 7.00 |
| Back Round 4 | 156 | 5.20 | 138 | 5.69 | 92 | 5.06 |
Here's the good news: running backs selected in the first two rounds of rookie drafts gradually score more points in each of their first three seasons, while backs picked up in the latter parts of rookie drafts tend to fall off. That means we, as a fantasy football community, are at least decent at predicting which players will succeed and which ones won't.
Here's the bad news: we're still pretty poor at predicting which players will succeed and which ones won't.
Even in Year 3 alone, top-six running backs have averaged just 12.23 points per game. That's just a mid-range RB2 number. And by Year 3, we still see an insignificant amount of points per game difference between back-end first-round running backs and front-end second-round ones.
Wide Receivers
The wide receiver position, as mentioned earlier, saw a stronger correlation between average draft position and three-year points per game average than the running back one did. But don't get too excited, because we're still pretty bad at projecting their futures:
| Draft Spot | Count | Total Games | Points | Points Per Game |
|---|---|---|---|---|
| Front Round 1 | 21 | 770 | 9,542.2 | 12.39 |
| Back Round 1 | 22 | 768 | 7,967.8 | 10.37 |
| Front Round 2 | 23 | 838 | 5,929.4 | 7.08 |
| Back Round 2 | 21 | 616 | 5,313.7 | 8.63 |
| Front Round 3 | 17 | 402 | 2,494.6 | 6.21 |
| Back Round 3 | 24 | 651 | 3,206.7 | 4.93 |
| Front Round 4 | 21 | 533 | 3,289.6 | 6.17 |
| Back Round 4 | 23 | 366 | 1,196.4 | 3.27 |
Once again, the front portion of the first round does provide the best return, but for some perspective, 12.39 PPR points per game would've ranked 23rd at wide receiver last season among wideouts with 10 or more games played. And it was a down year for the position, too.
To be fair, we've been pretty good at projecting the high-end players, similar to running back. Of the seven wide receivers that have been selected, on average, in the first two slots of rookie drafts, you may consider only one -- Tavon Austin -- a complete bust. Otherwise, you're looking at the aforementioned Sammy Watkins, and then A.J. Green, Mike Evans, Dez Bryant, Amari Cooper, and Corey Coleman. Perhaps you'd argue against Coleman and maybe Watkins, but Austin's the only clear-cut failure.
As you can see, there's a pretty large gap in three-year production once you hit the second round of these rookie drafts. And that's a consistent theme until you hit Year 3 of these players' NFL careers.
| Draft Spot | Yr 1 Games | Yr 1 PPG | Yr 2 Games | Yr 2 PPG | Yr 3 Games | Yr 3 PPG |
|---|---|---|---|---|---|---|
| Front Round 1 | 272 | 10.77 | 282 | 12.01 | 216 | 14.94 |
| Back Round 1 | 283 | 9.58 | 281 | 10.89 | 204 | 10.77 |
| Front Round 2 | 299 | 5.63 | 307 | 6.77 | 232 | 9.34 |
| Back Round 2 | 267 | 7.55 | 195 | 9.64 | 154 | 9.21 |
| Front Round 3 | 182 | 5.92 | 117 | 7.07 | 103 | 5.73 |
| Back Round 3 | 239 | 3.82 | 214 | 5.97 | 198 | 5.13 |
| Front Round 4 | 199 | 4.06 | 222 | 7.49 | 112 | 7.31 |
| Back Round 4 | 150 | 2.38 | 103 | 3.67 | 113 | 4.08 |
It's always nice when data aligns with intuition.
We know running backs get more immediate opportunity when they enter the league, and that showed above, as the gain each year by the running back groupings wasn't incredibly significant. Top-half first-round backs, for example, increased their points per game output by less than a point from Year 1 to Year 2, and then their averages went up by just 0.07 from Year 2 to Year 3.
That's not the case for wide receivers. In Year 1, a random top-six pick has averaged 10.77 PPR points per game, but that gradually increases to 14.94 when you get to Year 3. In 2017, a wide receiver averaging 15 PPR points per game was a low-end WR1, or a fringe top-10 receiver.
Making This Actionable
DeAndre Hopkins and Le'Veon Bell finished second in fantasy points per game at their respective positions last season. That was 2017. In 2013, they were being selected behind Eddie Lacy, Tavon Austin, Montee Ball, and Giovani Bernard in rookie drafts.
Well, that's embarrassing.
Except it's not. Drafting is difficult for NFL teams who pour hours and hours into evaluating players, so it's naturally going to be hard for someone living in his mom's basement to project the careers of running backs and wide receivers accurately year after year. Looking back and seeing Montee Ball being selected over Le'Veon Bell in a rookie draft may bring back haunting memories, but this stuff is hard. It's just not easy.
This is why we see the numbers that we see.
It'd be convenient for me to leave it at that, but I'm aware of the many "buts" that stem from a study like this one. But what about everything that happens after a player's first three years? But what if I'm better than my leaguemates at evaluating prospects? But what about measuring success in other ways aside from points per game?
These are all valid points. The beauty of fantasy football -- and football, if we're being honest -- is that nailing down a factual, can't-argue-it point is pretty tough to do.
We can, though, find trends. And we can use these trends to find edges throughout the game.
For example, if you're in win-now mode in your dynasty league and have a pretty balanced roster, would you want to draft a running back or a wide receiver early in your rookie draft? Well, based on instinct and the data above, the answer should be a running back: they're going to provide the most value right off the bat, whereas a wide receiver needs some time to get acclimated to the NFL game.
What if you're trying to win immediately and have, say, the third pick in your rookie draft? What if you're able to get, I don't know, Doug Baldwin for that selection?
Well, I'd argue strongly to sell the pick. I'd push to sell the pick even if you weren't in the perfect spot to win immediately. And it's not because there's zero chance a player you select there breaks free as an NFL superstar. It's that the odds of you finding a player who can produce like Baldwin over the next two or three seasons isn't nearly as great as you probably think.
This doesn't mean you should go and sell all of your rookie picks, by the way.
Market value matters. Just because you may devalue rookie picks more than the rest of your league doesn't mean everyone else will. If you've got a bottle of cheap vodka, but others view it as a top-shelf brand, then sell it as top-shelf vodka.
And having picks later in your draft can still yield top fantasy football talent. Like a lot of NFL teams try to do, compiling a lot of those second- and third-round selections instead of just having one in each round can increase your odds in hitting on a player. If you can trade off an asset that's rotting away on your bench, that makes all the sense in the world.
But giving away an established high-end player for someone who hasn't played an NFL snap? Based on history, that's probably not the best idea.


