


Analyzing Trends in FanDuel's 2017 Perfect Daily Fantasy NFL Lineups


All throughout our lives, we're taught that perfection isn't possible. You're going to make mistakes, so it's best to just own those and learn from them. Nobody's perfect.
Except for The Rock. We can make that one exception.
But that doesn't mean we can't learn from perfection. Sure, we can't all be 6'5", 260 pounds with arms that look like they were sculpted by someone with way too much time on their hands, but we can take certain attributes and apply them to the way we live. We can eat well, try to squeeze in some exercise, and strive to make our lives better, knowing that we'll never quite reach that mountain top.
It's the same thing with our lineups in daily fantasy football. On a traditional FanDuel roster, you've got nine slots to fill and a player pool that stretches beyond 400 different options. Some of those will certainly be more viable than others, but even then, good luck nailing all nine slots.
Just like with The Rock, though, we can learn from looking at perfection. And thankfully, trying to model our lineups after them will not force us to consume 2.3 pounds of cod each day.
Each week here on numberFire, we post the previous slate's perfect lineups for NFL DFS, showing the best roster you could have constructed while remaining beneath the salary cap. This gives us 17 regular-season perfect lineups to look at and from which to try to draw conclusions. Seeing the individual players in there may not help much, but the data around how those players got there certainly has value, especially when we look at the groups as a whole.
Today, we're going to do exactly that. We'll look back at each of the 17 FanDuel perfect lineups from the 2017 season to see which trends fleshed themselves out before extrapolating that into strategies we can carry with us into the start of the 2018 season.
We're going to break up things here to make it a bit easier to digest. We'll start it off by discussing the role that stacking played in the perfect lineups before going through a discussion of each position. So let's kick it off with stacking now, which showed up potentially more often than you would have expected.
Stacking
Stacking is a concept that makes more sense in theory than it does when you're pinpointing the top plays at each position each week. We know that the benefits of stacking are huge -- when a wide receiver catches a touchdown pass, you get points from him and his quarterback if you've rostered both -- but that doesn't necessarily mean the two will be the top plays at their respective positions.
That didn't stop stacks from cropping up in every single perfect lineup this year.
Across the 17 perfect lineups, there were 23 total occurrences in which two players from the same team wound up making the cut. Every perfect lineup had at least one stack, and six of them had two. If you ain't stackin', you ain't tryin'.
Three of these stacks included three players from the same team. Two of these three-player stacks included a team's quarterback, wide receiver, and tight end. The other went quarterback-wide receiver-kicker.
In all, this gives us 29 combinations of teammates who appeared in perfect lineups within the same week this year. Here's a breakdown of the positional pairings and how often they occurred. With this and all other graphs in the piece, you can click on the graph to enlarge it.
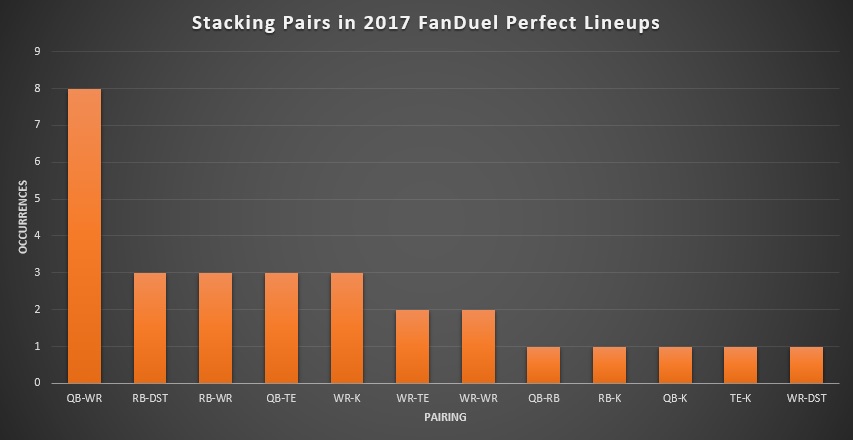
As you can see, a quarterback paired with one of his wide receivers was easily the most popular stacking option within perfect lineups. That combo occurred eight times, and no other combination popped up more than three times. A quarterback paired with his tight end happened three times, giving us 11 weeks out of 17 in which the quarterback was paired with one of his pass catchers. You may want to take note of that.
Another pairing that makes plenty of sense is a running back with his team's defense. If a team gets ahead, they're able to run the ball more often, increasing the odds that the back pumps out a big performance. It also forces the other team to throw, which can generate the high-upside plays like sacks and interceptions that we need to get huge defensive performances. It may not be as common as a quarterback with his pass catcher, but this is still a staple in our stacking creed.
One interesting trend elsewhere was how often kickers appeared alongside teammates. There were six instances in which a kicker was involved in a perfect lineup stack, and they were paired at least once with every position except for defense and special teams. It makes sense that wide receiver would be most common in this group (three instances) because the position is less dependent on touchdowns than quarterbacks and tight ends. Although we may not want to go out of our way to stack a kicker with various players on their team (each touchdown they score is one less field goal opportunity), we should be willing to do so if we believe it to be our optimal lineup.
Finally, this data seemed to show that we can occasionally pair teammates even if there's no direct correlation between their positions. There were three stacks with a running back and wide receiver, two with a wide receiver and tight end, and two with a pair of wide receivers on the same team. We likely shouldn't go overboard on a single team in one lineup, but using three players from one offense together is certainly at least viable.
Game Stacks
The other aspect of stacking is the strategy of using players from opposing teams in the same game, also known as game stacks. That way, if the game winds up being a shootout, you're getting exposure to both sides of the juiciness. This showed up in perfect lineups, as well, though to a slightly lesser extent.
There were 14 total instances in which at least one player from each team in a single game wound up being in the same perfect lineup. Six perfect lineups didn't have any game stacks, but three weeks had multiple. This is another strategy we should be deploying.
The next question would then be which pairings are optimal. The answers here are a bit less definitive than what we saw with single-team stacks above, but here's the breakdown of the data. Because four of the game stacks included multiple players from one of the teams, there are 18 total combinations listed.
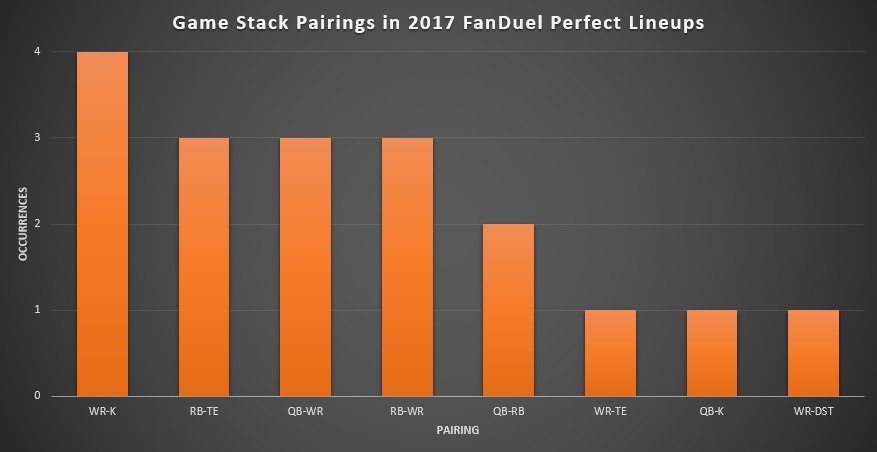
Pairing either a quarterback or a running back with an opposing wide receiver makes sense anecdotally, and both popped up three times. If a quarterback gets some touchdowns and puts his team ahead, the opposing team has to throw, boosting the opposing wide receivers. The same is true with running backs. When one team gets ahead, they get to run the ball while the other team is forced to throw, boosting both the back and the opposing receiver. We can figure out why these pairings popped. The others require additional thought.
The most common pairing (four instances) was a wide receiver with the opposing kicker. At first glance, this seems strange. But it also has similarities to a wide receiver with the opposing quarterback.
The easiest route to scoring fantasy points for both kickers and quarterbacks is putting points on the board, whether it's via a field goal or a passing touchdown. Every time they do that, the opposing team's incentive to throw increases. So while a wide receiver with an opposing kicker may not initially jump off the page as being an ideal stack, it's a pairing we should be willing to utilize.
Another intriguing combo near the top of the list was a running back with an opposing tight end. This isn't as obvious as a running back with an opposing wide receiver, but again, we'll see similarities between the two.
In the three instances that a tight end was paired with an opposing running back, those tight ends finished with 128, 97, and 98 receiving yards, respectively. Given those yardage totals, it's entirely possible that they benefited from the additional passing volume that could come from the opposing team getting a lead. It's the exact same narrative that allows us to stack a running back with an opposing wide receiver. We should be sure to also include tight ends in that internal discussion when crafting game stacks.
The overall trend here is pretty obvious: stacking -- whether it be with a single team or an entire game -- works. We should actively be trying to fit stacks into each lineup that we build, and most of those lineups should include more than one stack. If not, we're ignoring an element that was abundant in these perfect lineups, and that goes against our creed of modeling ourselves after perfection.
With that in mind, let's get into the positional breakdowns, starting with the quarterbacks. What do we need to know beyond that we should be pairing them with their pass catchers?
Quarterbacks
Quarterback is a unique discussion for perfect lineups because it can help guide us down the path of the age-old discussion: to pay up or not to pay up?
For each position, we'll look at the average numbers for each player who wound up in the perfect lineups. The only number that won't be the average for the group will be the "Home" category, which will simply show what percentage of the quarterbacks were at home when they wound up in the perfect lineups. Here's the breakdown at quarterback.
| Perfect Lineup QBs | Average |
|---|---|
| Salary | $8,012 |
| Pass Yards | 331.88 |
| Pass TDs | 3.47 |
| Rush Yards | 22.76 |
| Rush TDs | 0.29 |
| FanDuel Points | 30.90 |
| Home | 58.82% |
| Spread | -3.68 |
| Over/Under | 45.85 |
| Wind Speed | 2.59 |
We'll circle back to salaries in a second. First, let's focus on the stats needed to earn a slot.
Only three of the quarterbacks to make the cut threw fewer than three touchdowns. Two of them ran for at least one touchdown, and the other threw for 382 yards. So you need big production no matter what your price may be, and that production should largely come via touchdowns.
That's not to completely disregard yardage. Only two quarterbacks threw for fewer than 260 yards, and one of them -- Cam Newton, shockingly -- ran for 58 yards while the other had a rushing touchdown. The third-lowest passing yardage total was 261 from Deshaun Watson, but he paired it with five touchdowns. If a quarterback doesn't have a path to at least 30 FanDuel points, he doesn't belong on your tournament rosters.
That edict is true no matter what the quarterback's price may be. The chart below shows the salaries of the quarterbacks in the perfect lineups and the average fantasy outputs of the quarterbacks in that range.
| Salary | Occurrences | Average FanDuel Points |
|---|---|---|
| $9,000 or Higher | 2 | 33.25 |
| $8,500 to $8,900 | 1 | 28.24 |
| $8,000 to $8,400 | 3 | 27.97 |
| $7,500 to $7,900 | 10 | 31.20 |
| $7,000 to $7,400 | 1 | 34.72 |
| Lower than $7,000 | 0 | -- |
The 11 quarterbacks priced lower than $8,000 averaged 31.52 FanDuel points per game when they were in the perfect lineup; those priced at $8,000 or higher averaged 29.78. No matter what your price may be, you need to have upside.
The other important takeaway from that chart is that the grand majority of quarterbacks came from the middle tier of pricing. Not many from the Tom Brady and Aaron Rodgers pricing range made it, nor did those in the bargain bin. While this is just one year of data, it is noteworthy how concentrated the output was in that salary range.
This makes it seem as if we want to focus on that middle tier, but we have to keep in mind that upside is a necessity. How do we predict when those lower-priced assets will go off? The rest of the data can give us a pretty solid idea of that.
As you can see in the original chart, quarterbacks in the perfect lineups were on teams that were favored by an average of 3.68 points. The over/under was 45.85, which -- spoiler alert! -- was higher than every other position except for running back. That seems actionable.
There can be an incentive to use quarterbacks who are underdogs under the assumption that it will force their teams to air it out more. While the additional volume is true, not many quarterbacks who wound up on our list were underdogs. Here's the breakdown of the spreads.
| Spread | Occurrences |
|---|---|
| Favored by 10 or More | 3 |
| Favored by 5 to 9.5 | 5 |
| Favored by 0 to 4.5 | 3 |
| Underdogs by 1 to 4.5 | 5 |
| Underdogs by 5 to 9.5 | 1 |
| Underdogs by 10 or More | 0 |
Out of 17 quarterbacks, 11 entered the game as favorites, and eight were favored by at least five points. Not only should we avoid those projected to be trailing, but we shouldn't be overly afraid of those projected to win comfortably.
This is true of quarterbacks on the road, too. You'll note above that seven perfect quarterbacks played their games on the road; five of those quarterbacks were favored. One of the others entered as a one-point underdog. So when we do decide to use a quarterback playing outside of his home stadium, we should likely be giving heavy preference to those who are favored.
To close up things here, we need to address wind. Because hot diggity dog, was it important.
Not a single quarterback in the perfect lineup played his game in winds exceeding 10 miles per hour. There were just two in games with wind speeds above five miles per hour, and eight of them had no wind at all. We'll talk more about wind in the section on kickers, but if you're not considering it when filling out lineups, you're ignoring a critical piece of data.
As such, if we're looking for a quarterback in a given week, we should be favoring those who are priced roughly in the middle tier, favored in a game with a higher over/under, and playing in favorable weather conditions. There will obviously be exceptions to this, but that was the blueprint for finding perfection at quarterback in 2017.
Running Backs
Given how definitive it was at quarterback that you wanted a guy who was favored, you would think that trend would be even more extreme among running backs. That was absolutely not the case.
Here's the same breakdown as with the quarterbacks, looking at the averages at the position among the 34 running backs in perfect lineups.
| Perfect Lineup RBs | Average |
|---|---|
| Salary | $7,132 |
| Rush Yards | 101.88 |
| Rush TDs | 1.41 |
| Receptions | 4.09 |
| Rec Yards | 47.56 |
| Rec TDs | 0.62 |
| FanDuel Points | 28.93 |
| Home | 50.00% |
| Spread | -1.60 |
| Over/Under | 46.12 |
| Wind Speed | 5.35 |
Let's start off with a discussion around those spreads. Remember that the average quarterback was favored by 3.68 points, which is a good chunk more than running backs at 1.60. That goes a bit counter to what you'd expect with running backs receiving more volume once their teams were ahead.
Rather than looking at an average spread, here's each running back grouped by the spread entering the game. Although more than half of the running backs were favored, a considerable number were not.
| Spread | Occurrences |
|---|---|
| Favored by 10 or More | 4 |
| Favored by 5 to 9.5 | 7 |
| Favored by 0 to 4.5 | 8 |
| Underdogs by 1 to 4.5 | 8 |
| Underdogs by 5 to 9.5 | 6 |
| Underdogs by 10 or More | 1 |
Seven of 34 running backs (20.59%) to make the perfect lineup were on teams that were underdogs by five or more points. That's compared to just 5.89% of the quarterbacks. This is perplexing to say the least.
We can get a potential explanation by seeing at what point in the season underdogs made the cut. Of the 15 underdog running backs to make a perfect lineup, 11 came within the first six weeks. That means that in the first six weeks, there was only one running back who was favored who cracked the perfect lineup. We can build a narrative around that.
Early in the season, data on teams is going to inherently be incomplete. We don't yet know the full effect of offseason changes, and we don't know what early-season data we can trust. This is naturally going to make Vegas lines a bit less reliable, lowering the value we can derive from them.
If we look from Week 7 on, running backs to make the perfect lineups were favored by an average of 4.55 points. That's much more in line with what we would have expected going in, and it can provide us with a significant takeaway for 2018.
Based on this data, we shouldn't put much stock into Vegas' lines early in the year. They -- like us -- are operating on incomplete information, and it's going to create some definite funkiness. This isn't to say we should actively target running backs who are underdogs, but we shouldn't exclude someone from consideration simply because Vegas says their team isn't favored to win.
But once we get deeper into the season, we can once again start to put faith in what the lines are telling us. There were still later-season backs who wound up making the cut as underdogs, but they were far less fequent than earlier in the year. The tipping point this year was after Week 6, so we can use that as a bit of a reference for altering our process in 2018.
Another explanation for why underdog backs were able to achieve perfection lies in the receiving numbers listed above. The average perfect back had 4.09 receptions for 47.56 yards and 0.62 touchdowns through the air. Most of these guys were involved in the passing games, which allows them to be viable even if their teams fall behind.
On a more micro level, 25 of 34 perfect lineup running backs had at least three receptions in their games. Only three failed to record a single catch. This should show that even though FanDuel is a half-PPR site, finding backs with passing-game involvement is still important. We can't simply ignore it just because you aren't receiving a full point for each reception.
The other positive of getting a guy with passing-game involvement is that it allows him to rack up total yardage in a quicker fashion than by rushing alone. Four perfect backs had fewer than 50 rushing yards, and 10 of them had fewer than 75. But nine of those 10 had at least 30 yards receiving, and eight of them had at least 50 yards through the air.
While this should increase our interest in backs who get work as pass catchers, it's also a major red flag for guys who get most of their work in early-down scenarios. The nine players who had fewer than three receptions had to average 125.11 yards rushing and 2.11 rushing touchdowns in order to make the perfect lineups, and that's not a realistic expectation for most players of that mold in a given week. If a player doesn't get much work in the passing game, we should feel fairly comfortable looking elsewhere no matter how juicy his matchup may be.
Unfortunately, that type of running back doesn't come cheap, and the prices of players in the perfect lineups reflects that. Here's the breakdown of their salaries and the points produced by each pricing tier.
| Salary | Occurrences | Average FanDuel Points |
|---|---|---|
| $9,000 or Higher | 2 | 35.25 |
| $8,500 to $8,900 | 3 | 33.37 |
| $8,000 to $8,400 | 8 | 30.48 |
| $7,500 to $7,900 | 3 | 28.17 |
| $7,000 to $7,400 | 4 | 27.10 |
| $6,500 to $6,900 | 6 | 27.70 |
| $6,000 to $6,400 | 0 | -- |
| $5,500 to $5,900 | 2 | 25.80 |
| Lower than $5,500 | 6 | 26.42 |
Of the 34 perfect running backs, 13 of them (38.24%) had salaries of $8,000 or more. Two of the players priced below $5,500 made the perfect lineup after being thrust into larger roles due to a trade or injury. There weren't many guys who just popped up out of nowhere to make this list, and that is wholly significant.
At quarterback, we mentioned that it was the middle tier of pricing that was most fruitful. That's clearly not the case at running back. We should be willing to pay up if it gets us access to workhorse backs who will play on all three downs, and we need to identify backs transitioning into those types of roles who may be underpriced.
Wide Receivers
If we're spending big at running back, that likely means we'll have to cut back a bit at wide receiver. And -- to an extent -- that's what happened in the perfect lineups.
Let's start off things here with the overall breakdown before delving further into the salary analysis.
| Perfect Lineup WRs | Average |
|---|---|
| Salary | $6,824 |
| Receptions | 7.20 |
| Rec Yards | 129.84 |
| Rec TDs | 1.45 |
| FanDuel Points | 25.42 |
| Home | 58.82% |
| Spread | -2.16 |
| Over/Under | 44.26 |
| Wind Speed | 4.65 |
Remember that the average salary for running backs was $7,132, and we see a pretty decent jump down here to $6,824. Here's the distribution of the salaries for the 51 wide receivers to make a perfect lineup.
| Salary | Occurrences | Average FanDuel Points |
|---|---|---|
| $9,000 or Higher | 3 | 28.37 |
| $8,500 to $8,900 | 4 | 24.75 |
| $8,000 to $8,400 | 3 | 26.77 |
| $7,500 to $7,900 | 6 | 27.79 |
| $7,000 to $7,400 | 7 | 25.57 |
| $6,500 to $6,900 | 10 | 27.39 |
| $6,000 to $6,400 | 5 | 24.66 |
| $5,500 to $5,900 | 3 | 22.80 |
| Lower than $5,500 | 10 | 22.09 |
Just as we saw with quarterbacks, it's the second tier in pricing that comes up most often for wide receivers. Almost half (43.14%) of the perfect wide receivers were priced between $6,000 and $7,400. This is our sweet spot at the position.
Although this is partially because we need to roster three wide receivers compared to just two running backs, it's pretty clear that we should be paying up at running back more often. Here's a comparison of the two positions, splitting them into four separate pricing tiers.
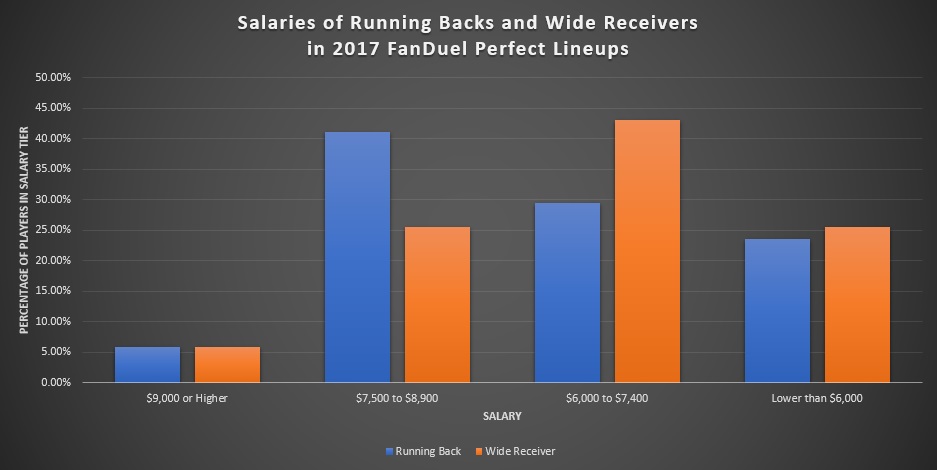
The largest blob for running backs was between $7,500 and $8,900 with 41.18% of the backs coming from that range. It was the tier below that for wide receivers with the aforementioned 43.14% coming between $6,000 and $7,400. Clearly, we should prioritize allocating salary to running backs over wide receivers on FanDuel.
While at running back we largely needed players to be at least somewhat involved in the passing game, it's more of an "either-or" proposition at wide receiver. They either need huge yardage upside or the potential to snag multiple touchdowns.
Of the 51 wide receivers in perfect lineups, 11 of them finished with 85 receiving yards or fewer; every single one of those 11 had at least two touchdowns. The only two receivers to be in the perfect lineup without scoring a touchdown had 182 and 149 receiving yards, respectively.
This gives us a set of questions we must ask ourselves before plugging a wide receiver into our tournament lineups:
1. Can this wide receiver get at least 85 yards?
2. Can he score two touchdowns?
If we can't answer yes to either, then that player has no business being in our lineups. This may seem obvious, but there were only 81 wide receivers with at least one game of 85 receiving yards, and only 46 receivers got there twice. This should help us narrow down the player pool and focus exclusively on the players with the upside we need for tournaments.
Finally, as with quarterbacks, we do need to address wind speeds at this position. Even though Davante Adams and Robby Anderson made the perfect lineup while playing in winds stronger than 20 miles per hour, they were very much the exceptions to the rule.
| Wind Speeds | Occurrences |
|---|---|
| 0 to 4 | 29 |
| 5 to 9 | 15 |
| 10 to 14 | 3 |
| 15 or Higher | 4 |
Those 29 occurrences in wind speeds of zero to four miles per hour represent 56.86% of the sample, and 86.27% of the perfect receivers were playing in single-digit wind speeds. If you're chasing players in gusty conditions, you're likely losing money.
Tight Ends
Tight end tends to be a treacherous position in DFS. Because they're not as heavily-involved as wide receivers, their volatility can make your head spin. As such, it can often be profitable to spend as little as possible at the position and hope for the best.
That's how things wound up in the perfect lineups, at least.
Before we show you the full breakdown, it's worth noting that being stingy at tight end is well suited for an exercise like this. The aforementioned volatility can keep prices in check, and when players hit the positive end of that volatility, they can pay big dividends. So even if the middle tier at the position had done well this year, there would likely be a bias toward the cheaper options in perfect lineups. It's just shocking how extreme that slant was this year.
| Perfect Lineup TEs | Average |
|---|---|
| Salary | $5,576 |
| Receptions | 6.12 |
| Rec Yards | 99.65 |
| Rec TDs | 1.29 |
| FanDuel Points | 20.32 |
| Home | 23.53% |
| Spread | -0.53 |
| Over/Under | 43.94 |
| Wind Speed | 5.00 |
That $5,576 average salary is despite three appearances from Rob Gronkowski, who was priced at $8,000 or higher each time. The distribution of the salaries makes the picture a bit more clear.
| Salary | Occurrences | Average FanDuel Points |
|---|---|---|
| $8,000 or Higher | 3 | 21.83 |
| $7,000 to $7,900 | 0 | -- |
| $6,000 to $6,900 | 1 | 23.40 |
| $5,000 to $5,900 | 3 | 18.73 |
| Lower than $5,000 | 10 | 20.02 |
Oh, boy. If it wasn't Gronk, you had better have been saving all that you could.
Travis Kelce cracked the perfect lineup once all year. Zach Ertz, Delanie Walker, Jimmy Graham, Evan Engram, and Kyle Rudolph -- the staples of the middle tier of pricing -- never did. That should say something about what you need to do at this position.
Thankfully, it's not all despair here. Even though 10 players came from the bargain bin, some of them you could have seen coming.
Tyler Kroft, Ed Dickson, Garrett Celek, Trey Burton, and Antonio Gates all made appearances in weeks in which their fellow tight-end teammates were inactive due to injury. Jack Doyle was just $4,900 when he made it, but his target market share was among the best at the position entering his big week. Some of the inclusions were a bit more random (looking at you, Ricky Seals-Jones), but for the most part, you could have predicted expanded workloads for most of the names on the list.
This is a significant takeaway for 2018. When a tight end is in a scenario in which his snap rate or target share will expand, we need to pounce. This is abundantly true at all positions, but here, we want to save as much as possible, making the discounts in pricing all the more alluring. We do need to be wary of investing in bad offenses given how touchdown-dependent the position is, but this should play a major factor in our decision-making, regardless.
For the most part, we can likely identify times when we should want to use guys like Gronk or Kelce. But what's the formula for snagging one of the cheaper options? Let's take a look at just those and see if we can learn anything.
Below is a chart of the average marks for tight ends priced below $6,000 for the 2017 season who made the perfect lineup (in other words, excluding Gronk and Kelce). This leaves us with 13 tight ends to examine, and the results were fairly interesting.
| TEs Priced Lower Than $6,000 | Averages |
|---|---|
| Receptions | 5.77 |
| Rec Yards | 89.92 |
| Rec TDs | 1.31 |
| FanDuel Points | 19.72 |
| Home | 23.08% |
| Over/Under | 42.88 |
| Spread | +1.54 |
| Wind | 4.92 |
The number that should jump out to you is the 1.31 touchdowns per game. Five of the 13 cheaper assets had multi-touchdown games, and only one failed to reach the end zone. We're basically just hunting for tuddies.
What's reassuring is that yardage is not nearly as important as it was for the full sample or at other positions. While the average was 89.92 yards per game, that includes a 175-yard day by Dickson. Only two other cheap options topped 100 yards. You don't need a guy with huge upside in that department to come out smelling like roses.
You would think, then, that we'd want to pilfer guys in games with high over/unders. That wasn't how the data played out. The largest over/under in this sample was 48, and six of the games had totals of 42 or lower. That seems a bit unusual.
This leads to a delicate balance when it comes to trying to pinpoint cheap tight ends who will go off. We don't need to treat Vegas information as gospel, as discussed in the section on running backs. Although it's useful data, we should not exclude a player from consideration exclusively because Vegas doesn't expect his team to go off, especially if that player is stepping into a larger role.
But at the same time, we can't go chasing tight ends on offenses that won't move the football. As mentioned, we do need touchdowns -- often more than one -- and poor offenses aren't going to give us that juice. If we can get them in a matchup with a wretched defense, then it may be time to pounce. Outside of that, though, we should not be chasing bottom-of-the-barrel aerial attacks.
This may make it seem impossible to correctly identify which cheap tight end will be the right choice in a given week. That alone could push you to pay up for more dependable assets even if they aren't necessarily the perfect selection, and it's hard to fault you for doing so. Still, though, we do need to take whacks at this lower range.
Each week, we should try to identify offenses that are in more favorable spots than they usually are to see whether or not that team's tight end is a viable option. If he boasts a respectable snap rate and gets a few targets each week, then maybe we can take that leap. But the perfect lineups make it clear that investing in this pricing tier can be a profitable endeavor if done correctly.
Defense and Special Teams
In the stacking section, we mentioned that there was a decently clear tie between running backs and their team's defense and special teams. As such, it shouldn't be surprising that our takeaways here are going to be similar to what we saw with the backs.
Let's just start it off with the overall breakdown that we have done in other sections.
| Perfect Lineup DSTs | Averages |
|---|---|
| Salary | $4,582 |
| FanDuel Points | 21.18 |
| Home | 52.94% |
| Spread | -2.12 |
| Over/Under | 42.59 |
| Wind | 6.35 |
In what should be a completely unsurprising result, the wind speeds here are higher than at any other position. We'll circle back to that in the next section on kickers, but again, weather is your friend in DFS.
You'll note that the average spread for a defense was to be favored by 2.12 points. That is slightly higher than we saw with running backs, but some of the same early-season noise will creep into the data at this position.
Here's a breakdown of the perfect defenses based on the Vegas spreads entering the game.
| Spread | Occurrences |
|---|---|
| Favored by 10 or More | 2 |
| Favored by 5 to 9.5 | 3 |
| Favored by 0 to 4.5 | 5 |
| Underdogs by 1 to 4.5 | 4 |
| Underdogs by 5 to 9.5 | 3 |
| Underdogs by 10 or More | 0 |
What should stand out most there is that three perfect defenses entered the week as underdogs by five or more points. But all three of those occurred within the first five weeks, and two of them were by a Jacksonville Jaguars team that wound up wildly exceeding Vegas' expectations of them entering the season. It's exactly the same as what we saw at running back (and Leonard Fournette was stacked with the Jaguars' defense in both of those early-season instances, as well).
The takeaway here should be pretty clear. In the first handful of weeks, we need to work hard to identify teams that are going to be better than what Vegas expects them to be. Whether it be offseason upgrades, an improved quarterbacking situation, or a boatload of draft picks, some team is going to jump out and shock the world. If we can identify that team and invest in their running back and defense, we can potentially earn a major leg up on the field by deviating from the spreads. That makes noting offseason movement abundantly necessary for that first month.
We can see similar takeaways in looking at the pricing on defenses for this season.
| Salary | Occurrences | Average FanDuel Points |
|---|---|---|
| $5,000 or Higher | 2 | 20 |
| $4,800 to $4,900 | 1 | 13 |
| $4,600 to $4,700 | 6 | 21.17 |
| $4,400 to $4,500 | 3 | 21 |
| $4,200 to $4,300 | 3 | 25 |
| Lower than $4,200 | 2 | 21 |
It's a bit daunting to see five instances in which a team priced at $4,300 or lower made the cut, right? It gets less intimidating when you look at which teams managed to do so.
One of them was the aforementioned Jaguars in Week 1 when they were facing Tom Savage and before we realized how good they'd be. Another was the New Orleans Saints in Week 6 when their defense had its national coming-out party. Overall, four of these five low-balling instances were within the first seven weeks, and the other was in Week 10 when the Atlanta Falcons mauled a Tyron Smith-less Dallas Cowboys offense. The cheapest defense from Week 11 on was priced at $4,500.
The best time to get weird and wild in DFS is within the first six weeks or so. We're still getting a feel for which teams will be good, and that leads to inefficient pricing. If we can jump on a bandwagon before Vegas and the public, we'll be sitting pretty at the end of a slate.
But overall with defenses, it is still clearly important to identify teams that are going to put their opponents in negative game script. This leads to additional passing drop backs, which are the only way to get those ever-important sacks and interceptions that can turn into something much bigger. We don't need to abandon our process early in the season, but we can have a bit more leniency if we identify teams that we believe will be better than projected.
Kickers
We're basically going to use this section as a PSA that wind matters in DFS. Here's a good explainer as to why.
| Perfect Lineup Ks | Averages |
|---|---|
| Salary | $4,771 |
| FanDuel Points | 18.71 |
| Home | 52.94% |
| Spread | -1.24 |
| Over/Under | 43.32 |
| Wind | 3.53 |
Even that average of 3.53 miles per hour can be a bit misleading due to two outliers within the sample. The distribution of those wind speeds should make the urgency here a bit more clear.
| Wind Speeds | Occurrences |
|---|---|
| 0 to 4 | 13 |
| 5 to 9 | 2 |
| 10 to 14 | 0 |
| 15 or Higher | 2 |
In a sample of 17 perfect kickers, just four came from games with wind speeds that exceeded four miles per hour. How bonkers is that?
Not shockingly, this makes kicker one of the positions more heavily influenced by wind on the board. Quarterback was the only position with lower average wind speeds across the perfect lineups this year, and defense and special teams was at the opposite end of the spectrum.
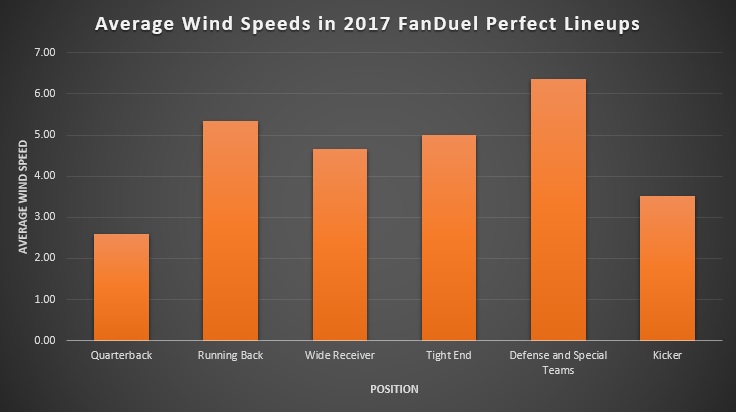
For context, the average wind speed across all games in 2017 was 5.77 miles per hour, according to data obtained from Chris Allen of FFCouchCoach.com. Every position outside of defense and special teams was below that, and running back was the only other position with average wind speeds exceeding five miles per hour. While we should put more emphasis on avoiding wind at quarterback and kicker, it's something we need to at least consider at every position.
So, with that said, let's shift back to this specific position. We want to avoid kickers in high-wind games. What do we need beyond that?
To a certain extent, kicker was similar to tight end. You wanted to pay down when you could, but it was not nearly as paramount here as it was there.
| Salary | Occurrences | Average FanDuel Points |
|---|---|---|
| $5,100 or Higher | 3 | 18 |
| $4,900 to $5,000 | 4 | 20 |
| $4,700 to $4,800 | 2 | 20 |
| $4,500 to $4,600 | 8 | 18 |
Additionally, one of those eight slots went to Greg Zuerlein in Week 1 before his pricing reflected how good he was. Harrison Butker made the cut in Week 5 before his season took off, and Robbie Gould made two appearances after Jimmy Garoppolo took over for the San Francisco 49ers. There's a common thread at all positions: identify players whose prices don't align with their situations.
One thing that could have been a bit surprising in the initial table was that kickers in perfect lineups were favored by an average of just 1.24 points, the lowest of any position outside of tight end. This becomes a bit less surprising when we look at the breakdown of those spreads.
| Spread | Occurrences |
|---|---|
| Favored by 10 or More | 2 |
| Favored by 5 to 9.5 | 4 |
| Favored by 0 to 4.5 | 4 |
| Underdogs by 1 to 4.5 | 3 |
| Underdogs by 5 to 9.5 | 3 |
| Underdogs by 10 or More | 1 |
The big outlier here is Aldrick Rosas in Week 6 when the New York Giants were 13.5-point underdogs against the Denver Broncos and wound up winning easily. That clearly had an effect on the sample as 62.50% of the other kickers were on teams that were favored, and 35.29% of the total sample were on teams favored by five or more points.
At the end of the day, we want to identify kickers on teams that are likely to win and playing in non-gusty conditions. If we can find that in a lower-priced asset, we should take the savings. If not, seven of the 17 kickers were priced at $4,900 or higher, so it seems acceptable to pay up when necessary.


