


This Year's Atlanta Falcons Have a Top-10 All-Time Offense


Comparisons always sound better in theory than in practice.
That's certainly true in sports. Teams can have terrible point differentials, play a weak schedule, and grade out as average by the eye test and metrics, but if they have a strong record, are they actually worse than a team that has a record that doesn't quite match their stellar stats?
It depends on who you ask.
And when you start to factor in era and play style, forget about it.
But that's not stopping us. We can't just throw our hands up and not try to figure things out. Not when the 2016 Atlanta Falcons' offense was this good.
Atlanta's Regular Season
This year, the Falcons scored 540 points, 71 more points than the second-place New Orleans Saints. They were one of just nine teams to top 400 points. They were, again, at 540.
To adjust for play volume (they ran 995 plays, 26th-most in the NFL), they were -- naturally -- even better relative to the rest of the league. Their 0.543 points per play was easily an NFL-best. The Saints were second at 0.424. Only six teams in total managed at least 0.4 points per play this season.
Atlanta was tops in yards per play (6.686) and were one of just three teams above 6.0 yards per play.
By our Net Expected Points (NEP) metrics, they posted the best score since 2000 (as far back as our metrics date). Their 276.84 opponent-adjusted NEP was one of two marks north of 260 in our database. They were -- coincidentally -- narrowly better than the 2007 New England Patriots' 276.24.
On a per-play basis, the Falcons had the best offense in the NEP era, with an Adjusted NEP per play of 0.260. New England's 2007 offense was second, again, at 0.246.
With the increases in offensive efficiency, though, how can we say for sure that this offense isn't just a product of its era?
Historical Context
The Falcons' 6.686 yards per play rate ranked fourth-highest in the Super Bowl era (from 1966 to the present), behind the 2000 Rams' 6.977, the 2011 Saints' 6.691, and the 2004 Indianapolis Colts' 6.689.
Their 0.543 points per play also ranked fourth, behind the 2011 Green Bay Packers (0.567), the 2007 Patriots (0.557), and the 1998 Minnesota Vikings (0.552).
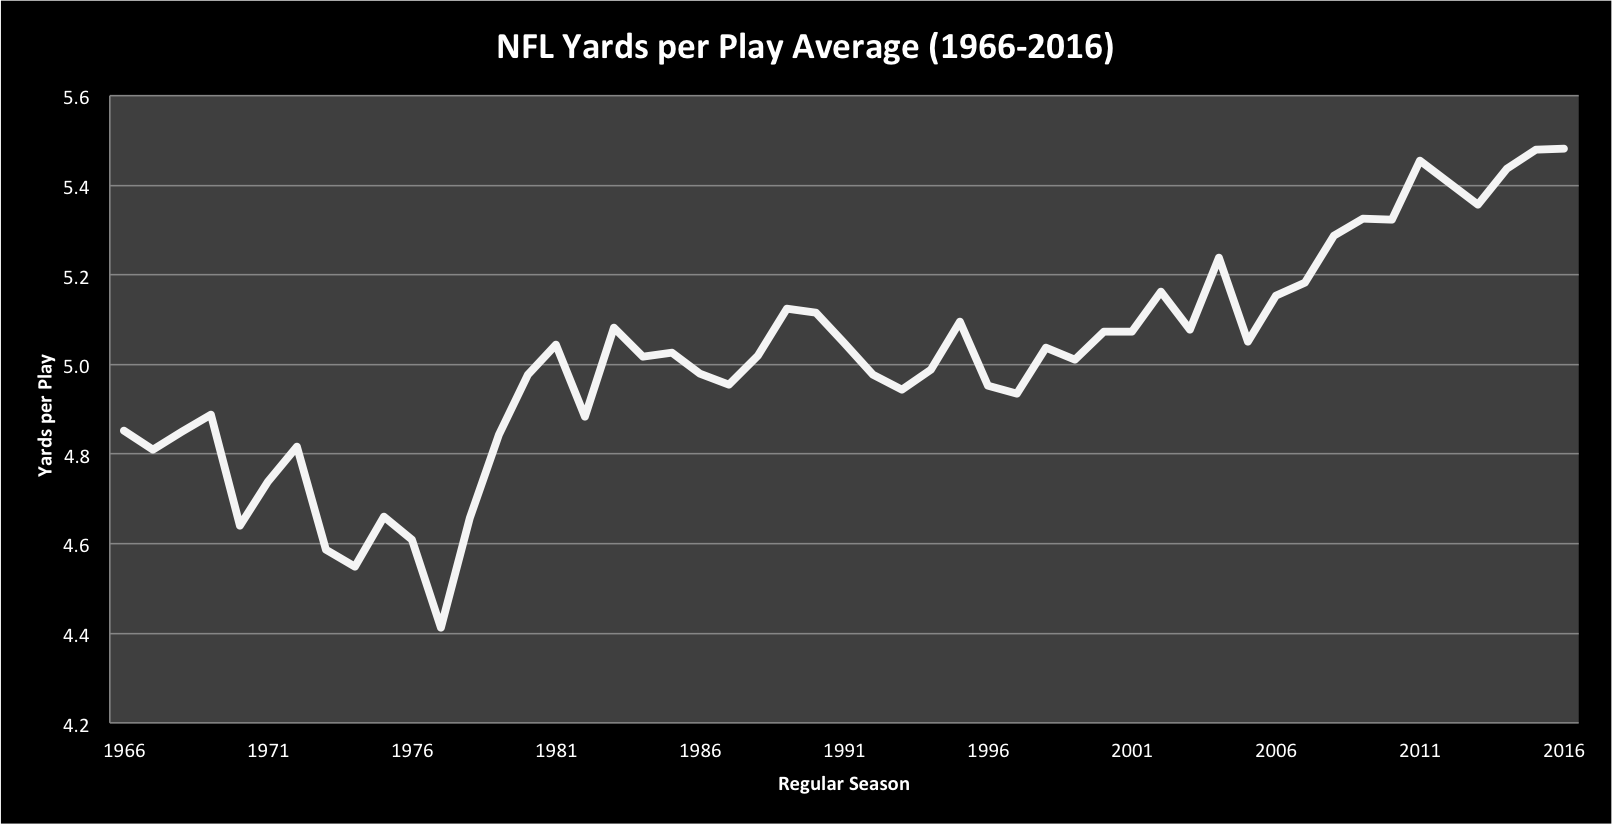
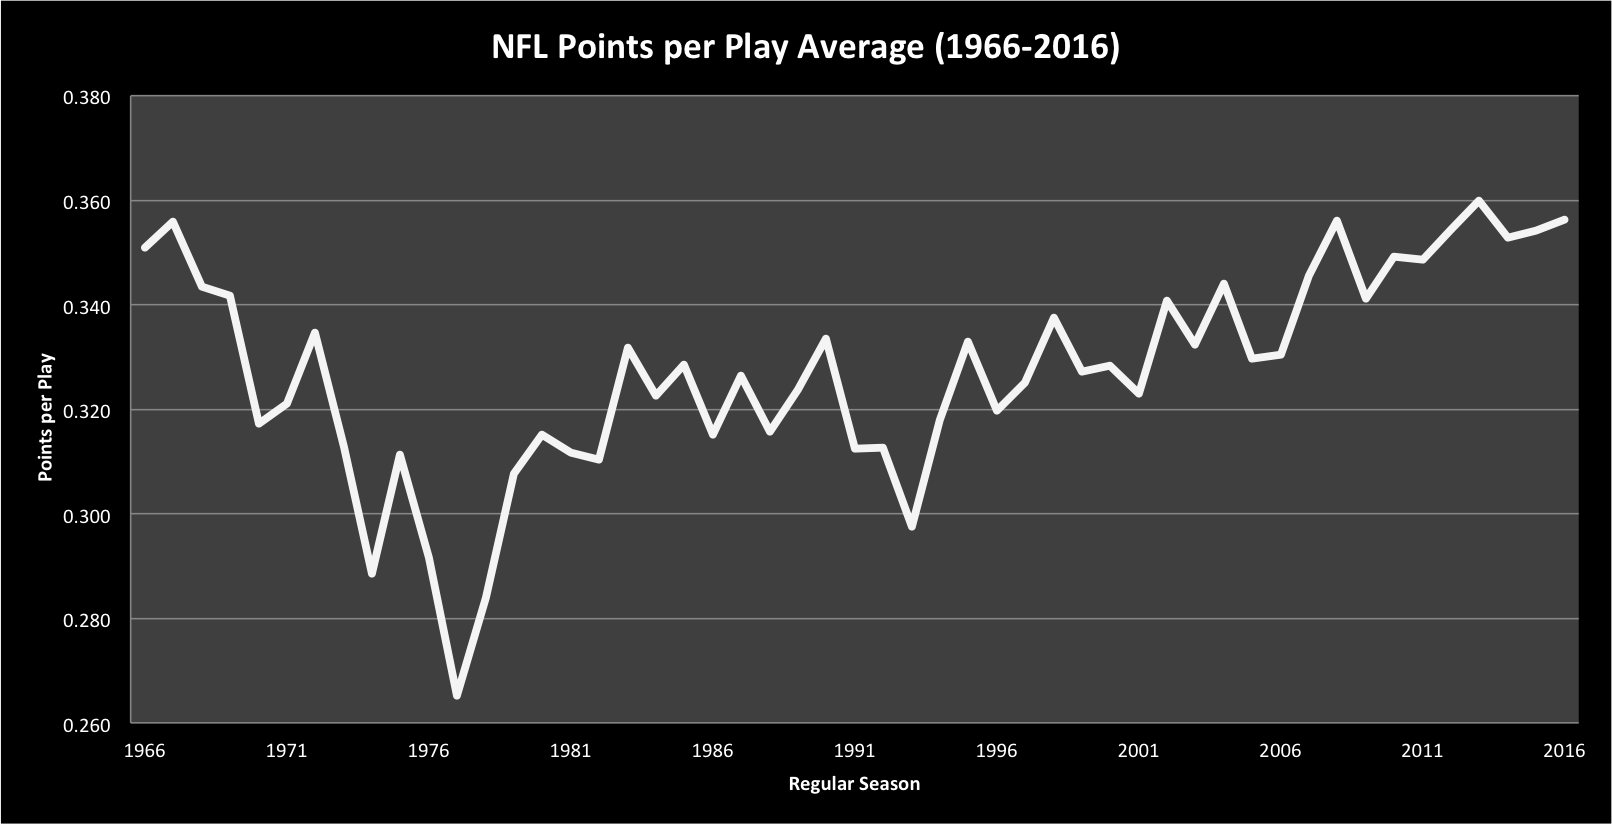
Of course, there's been an upward trend overall in yards per play and, to a lesser extent, points per play in the Super Bowl era, however.
So, to help adjust for this and to get a better feeling for how well the Atlanta offense truly ranks in NFL history, I'm afraid we need to use math.
Adjusting for Era
By finding each team's yards and points per play marks in the Super Bowl era, we can learn a lot.
For our sake, we're mostly interested in finding the league-average yards and points per play scores for each season (which is what you see in the graphs above). From that, we can see how widely distributed the production was from the league average and see how good or bad a team played compared to the in-season average. (We're finding a z-score for each season, and this shows us how many standard deviations a team played above or below average.)
We'll actually begin with NEP because the scope is narrower. Here are the top five offenses since 2000 based on our method.
| Season | Team | Adjusted NEP | NFL Average | Standard Deviations Above Average |
|---|---|---|---|---|
| 2007 | New England Patriots | 276.24 | 2.87 | 2.85 |
| 2010 | New England Patriots | 239.08 | 16.32 | 2.66 |
| 2013 | Denver Broncos | 248.90 | 33.36 | 2.58 |
| 2001 | St. Louis Rams | 143.77 | -25.05 | 2.58 |
| 2004 | Indianapolis Colts | 259.25 | 6.48 | 2.50 |
| 2003 | Kansas City Chiefs | 154.17 | -16.53 | 2.32 |
| 2016 | Atlanta Falcons | 276.84 | 78.04 | 2.29 |
| 2011 | New England Patriots | 236.18 | 25.35 | 2.28 |
| 2000 | St. Louis Rams | 168.70 | -19.21 | 2.27 |
| 2015 | Arizona Cardinals | 214.30 | 63.54 | 2.27 |
Despite being the top offense by Adjusted NEP and Adjusted NEP per play since 2000, the Falcons rank seventh when we factor in the increasing expected points in today's NFL.
We can already see how adding context helps shed light.
But why stop at 2000?
Let's apply the same practice for their yards per play.
| Season | Team | Yards per Play | NFL Average | Standard Deviations Above Average |
|---|---|---|---|---|
| 2001 | St. Louis Rams | 6.644 | 5.074 | 3.34 |
| 1982 | San Diego Chargers | 6.561 | 4.883 | 3.27 |
| 1984 | Miami Dolphins | 6.482 | 5.017 | 3.03 |
| 2000 | St. Louis Rams | 6.977 | 5.073 | 3.01 |
| 1990 | Houston Oilers | 6.185 | 5.116 | 2.79 |
| 1983 | Green Bay Packers | 6.129 | 5.082 | 2.75 |
| 1999 | St. Louis Rams | 6.451 | 5.010 | 2.67 |
| 1986 | Miami Dolphins | 6.255 | 4.979 | 2.55 |
| 2016 | Atlanta Falcons | 6.686 | 5.481 | 2.54 |
| 1985 | San Diego Chargers | 5.882 | 5.026 | 2.49 |
By this measure, the Falcons had the ninth-best offense in NFL history. Again, they ranked fourth all-time in raw yards per play, but even with the uptick in efficiency (overall 2016 was the most efficient year ever by yards per play), they remain a top-10 unit because of their dominance over the rest of the NFL.
Points per play, though? Are they really a top-10 offense ever?
| Season | Team | Points per Play | NFL Average | Standard Deviations Above Average |
|---|---|---|---|---|
| 2001 | St. Louis Rams | 0.500 | 0.323 | 3.16 |
| 1999 | St. Louis Rams | 0.529 | 0.327 | 3.06 |
| 2010 | New England Patriots | 0.525 | 0.349 | 3.06 |
| 1994 | San Francisco 49ers | 0.487 | 0.318 | 3.05 |
| 2016 | Atlanta Falcons | 0.543 | 0.356 | 3.02 |
| 2004 | Indianapolis Colts | 0.539 | 0.344 | 2.95 |
| 1993 | San Francisco 49ers | 0.463 | 0.298 | 2.88 |
| 2007 | New England Patriots | 0.557 | 0.346 | 2.82 |
| 1998 | Minnesota Vikings | 0.552 | 0.338 | 2.78 |
| 2011 | Green Bay Packers | 0.567 | 0.349 | 2.76 |
Yup.
Even when adjusting for the fact that NFL offenses in 2016 averaged more points per play than any season in the Super Bowl era other than 2013, the Falcons managed to rank as a top-five team ever.
Takeaways
Despite all of this, I'm sure you can make cases for saying that the Falcons don't have a top-10 offense ever, but I surely can't. When adjusting for the NFL averages year to year, this Falcons' offense ranks seventh in Adjusted NEP since 2000, ninth in yards per play since 1966, and fifth in points per play in that stretch.
Say what you will about today's NFL, but the 2016 Falcons put on one of the best offensive displays in league history.


