


NBA Finals: How the Cavaliers Can Beat the Warriors in Game 3


Something is rotten in the state of Denmark Ohio.
It's just about everything the Cleveland Cavaliers are doing in the NBA Finals.
The Cavs got their Finals rematch with the Golden State Warriors, but they haven't played as if they've been waiting for this second chance for a full calendar year.
The Warriors have outscored the Cavaliers by 48 points through the first two games of the Finals, the biggest such gap in NBA history.
That'll happen when your Effective Field Goal Percentage is 40.5%, the fourth-worst mark through two games of the NBA Finals ever, and your opponent is shooting 58.9%, the third-best Effective Field Goal Percentage to start a Finals.
Is there anything Cleveland can do?
Play Better?
The Cavaliers need to play better. That's some movie-quality advice, if you ask me.
But the question, of course, is how they can do that. The answer isn't very obvious.
The Warriors have beaten the Cavaliers in seven straight games dating back to last year's NBA Finals. Seeing what's worked in the past isn't very fruitful because, well, not much has worked.
And even in their wins against Golden State, certain things were ugly.
Here is Cleveland's shot chart from their Game 2 win (95-93 in overtime) during last year's Finals, courtesy NBA.com/stats.
Gross.
In their Game 2 win last season, the Cavs owned an Effective Field Goal percentage of 37.2%, worse than they're shooting during this year's Finals. The catch is that, although the Warriors shot 44.6%, they dominated the other Four Factors.
| 2014-15 Finals Game 2 | eFG% | Turnover% | O Reb% | FT/FGA | Off Rating |
|---|---|---|---|---|---|
| Cleveland Cavaliers | 37.2% | 10.8% | 28.6% | .311 | 94.6 |
| Golden State Warriors | 44.6% | 16.1% | 19.6% | .229 | 92.6 |
Cleveland shot miserably but snared second-chances and avoided turnovers. If you can't outshoot 'em, you might as well play a clean game.
The problem with that line of thinking is that Cleveland's Turnover Rate through Game 2 has been 14.9% (and the Warriors' has been 14.1%), and the Cavs are actually losing the offensive rebounding battle marginally (26.7% to 26.9%).
Here's where things get frustrating for the Cavaliers' chances.
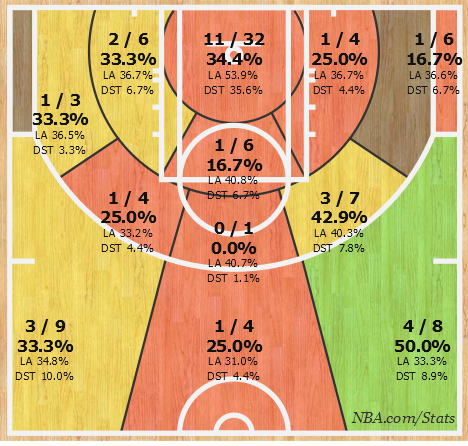
Check out their shot chart from their Game 3 win during last year's Finals -- yeah, they actually led the series 2-1 if you can believe it.

That's much prettier than their Game 2 chart. This game yielded an Effective Field Goal Percentage of 52.0% for the Cavs (and 46.7% for the Warriors). Remember when I said things get confusing?
They outshot the Warriors but got dominated on the offensive glass.
| 2014-15 Finals Game 3 | eFG% | Turnover% | O Reb% | FT/FGA | Off Rating |
|---|---|---|---|---|---|
| Cleveland Cavaliers | 52.0% | 13.9% | 17.6% | .224 | 105.6 |
| Golden State Warriors | 46.7% | 12.8% | 32.7% | .078 | 100.1 |
Sure, you don't need offensive rebounds if you can paint the shot chart green beyond the arc, but this is a complete reversal from their approach in Game 2. They lost the turnover battle in Game 3, too.
The point is that we can't look at things and say that the Cavaliers need to do a certain thing to win, that there is a certain variable that led to their success during last year's Finals. They secured an ugly Game 2 win with terrible shooting and a more aesthetic Game 3 win with great shooting.
So far in this series, they haven't shown an ability to do either.
| Cavaliers | eFG% | Turnover% | O Reb% | FT/FGA | Off Rating |
|---|---|---|---|---|---|
| Regular Season | 52.4% | 12.7% | 25.1% | .194 | 110.9 |
| NBA Finals | 40.5% | 14.9% | 26.7% | .209 | 90.9 |
Their Offensive Rebounding Rate is up, yeah, but again, they're still being matched by the Warriors (26.9%). The only edge they're holding over the Warriors is Free Throws per Field Goal Attempt (Golden State's mark is just .095), but that's the least important of the Four Factors.
Is there even a particular lineup that offers a glimmer of hope?
Not Really
The Cavaliers have seven unique lineups so far with at least three minutes against the Warriors in the Finals.
The best Net Rating of them all is -8.9, which comes from the Cavaliers' most-used lineup of Kyrie Irving, J.R. Smith, LeBron James, Kevin Love, and Tristan Thompson. That same lineup, in three regular season minutes, owned a Net Rating of 56.3 against the Warriors, and that small-sample success clearly hasn't carried over. The other five-man lineups with at least that much court time own a Net Rating of -16.1 or worse in the Finals.
This is going to happen when you're getting blown out, but only one player has improved upon his NBA Finals Net Rating from last season, and that dude has averaged just six minutes so far in this Finals.
| NBA Finals Net Ratings | Minutes/Game | 2014-15 | Minutes/Game | 2015-16 | Change |
|---|---|---|---|---|---|
| James Jones | 19 | -8.1 | 6 | -5.2 | 2.9 |
| Tristan Thompson | 41 | -16.6 | 25 | -22.6 | -6.0 |
| J.R. Smith | 34 | -18.6 | 35 | -27.9 | -9.3 |
| LeBron James | 46 | -7.5 | 37 | -24.7 | -17.2 |
| Kyrie Irving | 44 | 2.1 | 35 | -26.9 | -29.0 |
| Timofey Mozgov | 28 | -3.7 | 7 | -39.4 | -35.7 |
| Iman Shumpert | 36 | -11.8 | 18 | -53.0 | -41.2 |
| Matthew Dellavedova | 32 | -7.9 | 14 | -65.6 | -57.7 |
We shouldn't forget to point out Kevin Love's -19.6 Net Rating in 29 minutes per game, either. Oh, and Channing Frye has a Net Rating of 1.9 in 11 minutes, but he saw just four minutes in Game 2.
Back to the Drawing Board
The Cavaliers have a lot to figure out, especially considering that Kevin Love is questionable for Game 3, but nothing stands out as obviously necessary.
Their historically high Three-Point Attempt Rate to start the NBA playoffs has plummeted to 27.0% through two games of the NBA Finals. They are playing like a different team than what got them to the NBA Finals, and very little in the advanced numbers offer hope.
In this instance, all that can save them is a scrappy win, like they had last year in Game 2, or a regressive shooting night, like they had in Game 3 of last year's Finals.
And we haven't even gotten into how they will stop the Warriors' elite shooting while making these corrections to their own offense.
Nothing has worked for Cleveland so far, but at home in Game 3, numberFire Live gives them a 53% chance to earn their first victory.
But even as a slight favorite to close the gap to 2-1, it's no surprise that our algorithm gives them just a 10.21% chance to hang a championship banner in Quicken Loans Arena.


