


The Correlation Between Team Stats and Offensive and Defensive Efficiency, Part 1: Steals


In this series, we are going to look at a variety of team statistics – steals, blocks, rebounds, fouls, and pace – and how they correlate with offensive and defensive efficiency. To do this, I have collected team data for the past 10 years. I have graphed each point, and when we apply a linear trendline and analyze the coefficient of determination (R²), we can start to make some observations.
In order to even out the data, all of the team stats will be paced-adjusted, done by setting them all to per 100 possessions. Also, in order to even out differentiating schedules, I will also be using adjusted offensive and defensive ratings, which account for strength of schedule every year.
Let’s start with steals.
How Steals Affect Team Offenses
The data here is interesting. When I first started researching this topic, I initially graphed out the data after two years of accumulation. As you can see, there is a clear positive correlation: the graph shows that the more a team steals the ball (x-axis), the more efficient you would expect the offense to be (y-axis). This makes sense when you think about it. Getting steals often lead to fast break opportunities, which often lead to lay-ups and dunks – high-efficiency shots.
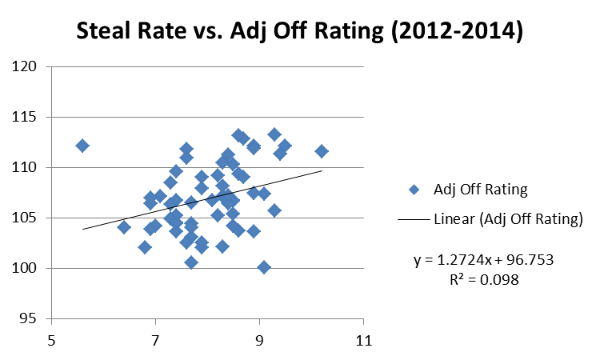
If you need a crash course in statistics, the equation on the right of the graph is pretty neat. The number beside “x†is what we can expect from the offensive or defensive rating for every one steal. So, for the two-year data graph, on average, teams have increased their offensive efficiency by 1.27 for every steal they make. Or in simpler terms, in the past two years, a team has scored an extra 1.27 points per 100 possessions for every steal.
However, when expanded to 10 years of data, the trend becomes less apparent. There is still a positive correlation; however, it shrinks significantly. In the past 10 years, a steal would, on average, lead to an extra 0.27 points per 100 possessions.
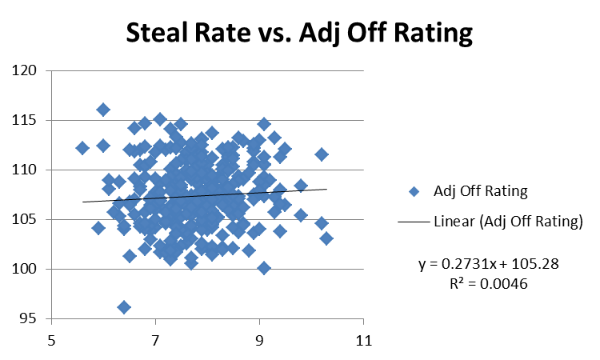
Another good piece of information is R², found right under the equation on the right. This is called the coefficient of determination, and it tells us how well our linear trendline actually fits with the data. If the number was 1, it would be considered a perfect fit, and all of our data points would fall directly on the trendline. The lower the number, the less accurate the trendline.
So as our R² drops from 0.098 in the first two years to 0.005 in the total ten, an inference can be made that while it still shows a positive correlation, there in fact might be no correlation.
How Steals Affect Team Defenses
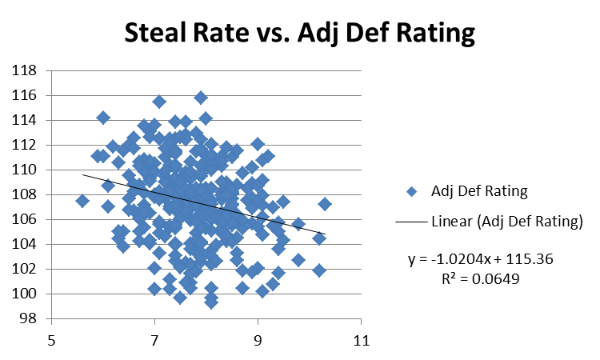
What happened between the 2-year data and the 10-year data in regards to offenses, was the opposite with defenses. While the data after two years showed correlation between steals and good defenses, it wasn’t significant enough and led me to believe there was no correlation. However, once the 10-year data was graphed, it shows that there might be a correlation after all.
There has been much discussion by NBA analysts throughout the years about the value of a steal. Benjamin Morris at fivethirtyeight.com wrote a great piece last spring about this very topic, and concluded that “a marginal steal is weighted nine times more heavily when predicting a player’s impact than a marginal point.†The follow-up question has always been: Does it affect offenses or defenses more?
Ricky Rubio was the NBA steals leader last season, totaling 191 on the year. Real Plus-Minus rates him as a +1.43 on the offensive end and +2.47 on the defensive end. Steal rate is built into their algorithms, and it’s obviously highly valued, as Rubio, not considered an elite one-on-one defender – like Avery Bradley, Eric Bledsoe, Patrick Beverley, Mike Conley, or Kyle Lowry, for example – is ranked the second-best point guard defender by RPM.
Our R² value for defenses is still not great, but it does show more consistency than our offensive data. On average, in the past 10 years, a steal has equated roughly to a savings of 1.02 points per 100 possessions.
Conclusion
The jury is still out on the value of steals, and the data is far from definitive. We have some years like last season, where a top-three steals team in the 76ers ranked bottom-five in adjusted defensive rating. However, some years we have the exact opposite.
There is a lot more to the nature of steals than can be found in raw data – how teams go after steals, the percentage of their gambling that pays off, etc. – but studying trends can be useful. At the very least, the numbers show us that guys like Rubio are indeed valuable on the defense end. Exactly how valuable is obviously the question still out there. But we’re getting closer.
Up next: blocks!


