


Brandan Wright: King of Advanced Analytics


The topic of analytics is a divisive subject in the sporting world, particularly when it comes to basketball. Those of us who embrace the movement (reminder: we’re called numberFire for a reason) see how the metrics correlate with what we are able to see with our peepers a large majority of the time, and we're therefore able to put a lot of trust in what the numbers tell us.
Even people who are vehemently against the growing use of analytics in sport would have a hard time denying that players who top the leaderboards in a given metric - particularly the most popular one-number iterations like player efficiency rating (PER) and win shares (WS) – tend to be the same players that the general, non-number-trusting public vote into All-Star games and whose jerseys they buy and wear. In the end, we argue a lot, but we at least tend to agree that great players are great.
Sometimes, however, there are anomalies that climb the ranks in advanced metrics – players who aren't necessarily household names, but still manage to sit right alongside them on the leaderboards. Brandan Wright of the Dallas Mavericks is one such anomaly.
Wright didn’t qualify for the official NBA leaderboards last season because he fell short of the minimum qualification of 70 games or 2,000 minutes played. Even so, his 58 games and 1,077 minutes represent a big enough sample size that he should hardly be ignored outright. If you were to reduce the minimum requirement to 1,000 minutes, Brandan Wright’s name would start popping up in a lot of places you wouldn’t expect it to when sorting through stats.
PER is becoming one of the most widely recognized metrics for comparing players by one, all-encompassing number. In the words of its developer, John Hollinger, once of ESPN, now of the Memphis Grizzlies, “PER sums up all a player's positive accomplishments, subtracts the negative accomplishments, and returns a per-minute rating of a player's performance." Given the “per-minute†aspect of the definition, it’s no surprise that some players are able to post excellent PERs in limited playing time. The majority of those blips, however, are easily dismissible because the samples are far too small and the chance for natural regression has simply not taken its course. As stated, however, Wright’s sample is just big enough that it stands out.
Take a look at the top 20 in PER last season with Wright slotted in where he would’ve been if the minute minimum were 1,000 minutes instead of 2,000.
| Player | PER | |
|---|---|---|
| 1 | Kevin Durant | 29.8 |
| 2 | LeBron James | 29.3 |
| 3 | Kevin Love | 26.9 |
| 4 | Anthony Davis | 26.5 |
| 5 | DeMarcus Cousins | 26.1 |
| 6 | Chris Paul | 25.9 |
| 7 | Russell Westbrook | 24.7 |
| 8 | Carmelo Anthony | 24.4 |
| 9 | Stephen Curry | 24.1 |
| 10 | Blake Griffin | 23.9 |
| 11 | Dirk Nowitzki | 23.6 |
| 12 | James Harden | 23.5 |
| 13 | Brandan Wright | 23.5 |
| 14 | Al Jefferson | 22.7 |
| 15 | Andre Drummond | 22.6 |
| 16 | Dwyane Wade | 22.0 |
| 17 | LaMarcus Aldridge | 21.8 |
| 18 | Goran Dragic | 21.4 |
| 19 | Dwight Howard | 21.3 |
| 20 | Tim Duncan | 21.3 |
19 players whose names come up in just about every All-Star, All-NBA, or future Hall of Famer debate...and Brandan Wright. Interesting.
What about win shares? A win share is an estimate of the number of wins a player contributed to his team in a given season. It's a cumulative stat, so it's largely minute dependent. A way to eliminate the minute bias from the equation, however, is to look at win shares per 48 minutes of play (WS/48). That way, we can put everyone in the league on a (relatively) even playing field and compare just how much they contributed to their teams on a per-minute basis.
Here's last year’s WS/48 leaders with Brandan Wright slotted in where he would have been if he had met the minute requirement:
| Player | WS/48 | |
|---|---|---|
| 1 | Kevin Durant | 0.295 |
| 2 | Chris Paul | 0.270 |
| 3 | LeBron James | 0.264 |
| 4 | Kevin Love | 0.245 |
| 5 | Brandan Wright | 0.227 |
| 6 | Stephen Curry | 0.225 |
| 7 | James Harden | 0.221 |
| 8 | Anthony Davis | 0.212 |
| 9 | Blake Griffin | 0.205 |
| 10 | Dirk Nowitzki | 0.199 |
The best and brightest players in the NBA...and Brandan Wright. Noticing a trend?
Our own nERD metric is a Brandan Wright fan as well. It’s not quite so generous as the other metrics (usage plays a big role in ours), but it still places Wright as the 23rd-ranked player on our player power rankings from the 2013-14 season at 6.4, ahead of guys like Chris Bosh, DeMarcus Cousins, and Dwight Howard, just to name a few. Considering that nERD is an estimate of how many wins above or below .500 a league-average team would finish a season with the player in question as one of its starters, one could argue that Wright’s contributions to his team have a more positive effect than those of the aforementioned stars.
This is exactly the point where those who poo-poo analytics would have my head. It’s important to note that no one is saying that Wright is a better player than Bosh, Cousins, or Howard (don't be ludicrous), simply that his positive contributions seem to outweigh his negative ones on a per-minute basis more so than those other guys. A number of factors like usage rate and role play in, of course, but it’s still very interesting to consider.
If you look at the numbers, free of bias, they say that Wright contributed more positively in his time on the floor than the vast majority of NBAers. That doesn’t mean he should be an All-Star necessarily, just that perhaps he should be more recognized as one of the NBA’s best role players. The numbers scream that he does a whole lot with a little on a consistent basis and that is worth something. His 9.1 points and 4.2 rebounds in 18.6 minutes per game doesn't put him on a lot of radars, but his per-36 numbers might turn a few heads.
| 2013-14 (per-36) | PTS | FG% | FT% | REB | AST | STL | BLK | TOV |
|---|---|---|---|---|---|---|---|---|
| Brandan Wright | 17.5 | 67.7% | 72.6% | 8.2 | 1.0 | 1.1 | 1.8 | 1.2 |
Not bad, right? What should stand out there, regardless of minute distribution, is the shooting efficiency. If you're wondering just how Brandan Wright found the Konami Code for breaking advanced metrics in basketball, there it is. He's good at making shots near the rim, so he takes a lot of his attempts from there. Pretty simple.
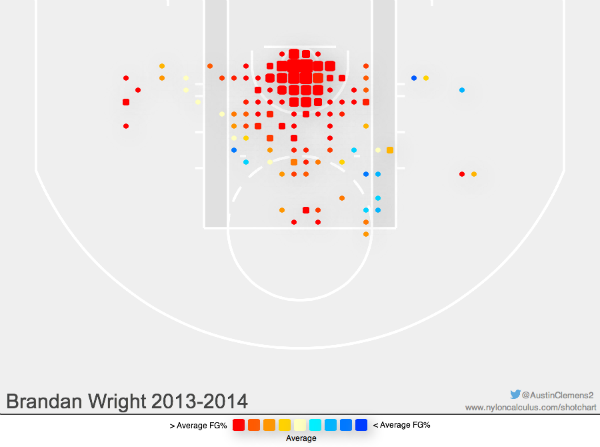
The shot chart shown above (developed by Austin Clemens for Nylon Calculus) denotes shot volume with the size of the spots on the floor (big spots equals high volume), and has a color scale from dark red (way above average success rate) to dark blue (way below). Put simply, Wright took a lot of his shot attempts at the rim and made them at a scorching hot rate. Of his 331 total field goal attempts on the year, 240 of them (72.5%) came from within five feet of the basket. On those attempts, he shot a downright ridiculous 76.7%. His overall field goal percentage of 67.7% and true shooting percentage (weighted twos, threes, and free throws) of 69.5% would’ve both led the league if he had qualified.
Advanced metrics in basketball focus heavily on efficiency, so it’s no surprise to see Wright benefit from just sticking to what he does well. In fact, his offensive rating (estimated points produced per 100 possessions) of 135, according to basketball-reference.com, would have also led the league – you guessed it – if he had played enough games or minutes to qualify. Keeping the 1,000-minute floor in mind, he also ranked well in block percentage (4.2%, 9th in the league and ahead of Andre Drummond and Dwight Howard), rebound percentage (13.1%, 33rd), and turnover rate (8.5%, 9th). Combine all those things and you get one of the highest rated players in basketball across the board.
The Dallas Mavericks reloaded this summer and look poised to contend in a competitive Western Conference. A lot of attention will be paid to the new players coming in and how they’ll mesh with Dirk and Monta, but keep an eye on Brandan Wright. He won’t stand out too much, but he might very well be the one quietly and efficiently making a difference.


