


Using Whiffs to Predict Strikeout Rate


If you’ve read any baseball analysis in the past three weeks, you’ve probably seen phrases like "it’s still early,†“it’s a small sample,†or “this may not be indicative of true talent†more times than you can count.
This is obviously for good reason, as players have not had enough at bats or thrown enough innings that we can be confident in much of anything. Saying things like Daniel Murphy is a good bet to win the National League batting title is just irresponsible.
The games’ top pitchers are just beginning to clear the 70 batters faced threshold, which is the point that strikeout rates hit their stabilization points. Even this, though, does not mean that pitcher’s strikeout rate today is his new true talent rate; rather, it just means that his performance to date has as much to with the player as it does random variation.
We can mitigate some of the issues here by using statistics that build a large sample quickly, such as those that work on a per pitch, rather than per plate appearance, inning or game rate.
Consider the fact that big league pitchers have thrown 4,113 innings while facing 17,381 batters. Those are some big numbers.
They also pale in comparison to the number 66,950, which is the number of pitches that have been thrown in 2016.
These more granular per pitch stats have a number of uses, but here, we’ll focus on using swinging strikes per pitch to predict future strikeouts.
Expected Strikeouts
We could reasonably infer whiffs and strikeouts are very closely connected, and the numbers back this up. From 2012 to 2015, strikeouts per plate appearance and swinging strike rate correlated at 0.83, with one implying a perfect correlation and zero implying no correlation (among the 336 individual seasons during this time).
If we look at 2016, the correlation coefficient is 0.71. It’s smaller, but if we square the coefficient, it still accounts for over the variance in strikeout rate so far.
It should be noted that as the season goes on and pitchers have faced more batters, the value of using the granular stats to predict strikeouts declines. Strikeouts on their own are fairly reliable, and in 2014 and 2015, first-half strikeout rate predicted second-half strikeout better than first-half swinging strike rate (though both performed well; strikeout rates from half to half correlated at 0.71, while first-half swinging strike rate and second-half strikeout rate correlated at 0.62).
That said, it is probably still early enough in the season that whiffs can serve as a useful tool to predict future strikeouts.
With that in mind, here's the graph indicating the relationship between swinging strike rate and strikeouts for the 103 qualified pitchers this season (keep in mind the MLB averages for swinging strike rate and strikeout rate are 10.3% and 21.7%, respectively).
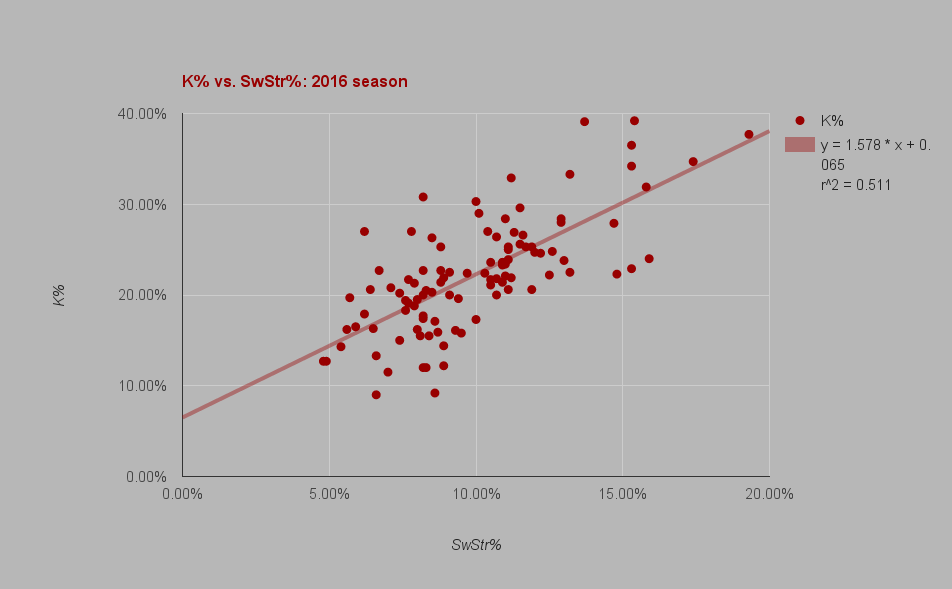
In the top right corner, we have Noah Syndergaard, who leads all pitchers in swinging strike rate (19.3%) and is third in strikeout rate 37.7%; he’s joined in that box by Drew Pomeranz, Danny Salazar, Vincent Velasquez, Drew Smyly and David Price.
Impressive as this may be, this data is probably more useful to spot outliers on both ends, including the pitchers with many whiffs and fewer strikeouts (buy low candidates) and those with high strikeout rates that lack the underlying whiff rate (sell high guys).
The following seven pitchers have outperformed their expected strikeout rate by 8.0% or more this year.
| Name | SwStr% | K% | xK% | Diff |
|---|---|---|---|---|
| Rick Porcello | 8.20% | 30.80% | 0.194396 | 11.36% |
| Jose Fernandez | 13.70% | 39.10% | 0.281186 | 10.98% |
| Juan Nicasio | 6.20% | 27.00% | 0.162836 | 10.72% |
| Jaime Garcia | 11.20% | 32.90% | 0.241736 | 8.73% |
| Vincent Velasquez | 15.40% | 39.20% | 0.308012 | 8.40% |
| Ubaldo Jimenez | 7.80% | 27.00% | 0.188084 | 8.19% |
| Aaron Nola | 10.00% | 30.30% | 0.2228 | 8.02% |
In the cases of
Fernandez, Velasquez, Garcia and Nola, even if their strikeout rates do regress towards what we might expect from their whiff rates, they’ll still be striking out an above average number of batters, so these are probably guys you’ll want to hold.
You probably should not rush out to sell Porcello either, as he also has strong career walk and groundball rates that continue to make him attractive. Strikeout rate regression is almost certainly coming though, as his career average is 15.4% and he set a career high of 20.2% last season.
Things get more dicey with Jimenez and especially Nicasio.
Jimenez does have some history of out-pitching his whiff rates, as his career strikeout rate is 21.5% despite a swinging strike rate of just 8.5%, so perhaps he can continue doing what he is doing. It is harder to say the same for Nicasio, who did set a career in strikeout rate (25.0%) last season, but also had the underlying whiff rate (11.0%) to back it up. This season, he is in the bottom 10 in terms of whiff rate, and if he continues this alongside his 11.0% walk rate, he becomes a very unattractive option.
On the flip side, here are pitchers who have underachieved relative to their whiff rates (these eight have an xK% that is 7.0% higher or more than their actual K%).
| Name | SwStr% | K% | xK% | Diff |
|---|---|---|---|---|
| Alex Wood | 8.60% | 9.20% | 0.200708 | -10.87% |
| Kyle Gibson | 8.90% | 12.20% | 0.205442 | -8.34% |
| Adam Wainwright | 6.60% | 9.00% | 0.169148 | -7.91% |
| Corey Kluber | 15.30% | 22.90% | 0.306434 | -7.74% |
| Matt Harvey | 8.30% | 12.00% | 0.195974 | -7.60% |
| Michael Pineda | 15.90% | 24.00% | 0.315902 | -7.59% |
| Cole Hamels | 14.80% | 22.30% | 0.298544 | -7.55% |
| Martin Perez | 8.20% | 12.00% | 0.194396 | -7.44% |
In
Wood and Gibson’s cases, it seems that better sequencing good lift them to roughly average K%s. Kluber, Hamels and Pineda’s whiff rates imply their strikeout rates could regress from good to great. In Pineda’s case, his 5.29 ERA despite a 18.7 K-BB% rate and 3.57 xFIP already made him a solid buy-low target, and the potential for even more strikeouts makes him even more attractive.
For Harvey and especially Wainwright though, this data raises more red flags for these would-be aces.
Harvey is coming off a 4.4 fWAR season when he struck out nearly a quarter of the batters he faced, while getting them to whiff on 11.6% of the pitches he threw. His xK% implies his paltry 12.0% strikeout rate might not be as bad as it seems, but even a 19.6% strikeout rate is low for a pitcher of Harvey’s caliber.
His pitch usage is roughly in sync with that of last season, though perhaps the decline in whiffs have a something to do with a his velocity declining across the board (then again, this is not uncommon for a pitcher in April).
As for Wainwright, his problems have gone beyond strikeouts, as he has pitched to an 8.27 ERA with an 11.5% walk rate, doing little to reduce the concern over his 2015 Achilles injury. Things have been bad enough that expected strikeout regression to a still-very low 16.9% won’t come close to help to fixing things.
I plan on revisiting these pitchers at the All-Star break to see how they did, but in the meantime, enjoy the latest productions of Small Sample Size Theater.


