


What Can We Expect From Marco Estrada in 2016?


One of famed British author Charles Dickens’ most under-appreciated works was A Tale of Two Marco Estradas.
“It was the best of Marco Estradas. It was the worst of Marco Estradas.
It was the age of contact management. It was the age of ball-in-play luck.
It was the epoch of 3.5 Wins Above Replacement. It was the epoch of below average pitching.
It was a season traditionalists loved. It was a season statheads are skeptical of.â€
Maybe Dickens didn’t actually write that, but if he did, he would have been on the money, as Estrada’s 2015 season really was filled with contradictions.
In terms of run prevention, it was a banner year, as the 32-year-old posted career-bests in ERA (3.13), runs allowed per nine innings (3.33), WHIP (1.04), hits allowed per nine innings (6.7), and RE24 (21.6; which measures a pitcher’s impact on run expectancy). He also won a career-high 13 decisions, if you’re into such things, helping him finish in 10th in the American League Cy Young voting.
Estrada had never received a Cy Young vote before, as his career ERA prior to 2015 was 4.23.
The wholly backwards-looking WAR used at Baseball-Reference (rWAR), which is based round RA/9, had Estrada as a 3.5-WAR pitcher. Baseball Prospectus’ mixed-model PWARP is also backwards-looking (but does strip out sequencing and adjusts for a myriad contextual factors), also had Estrada at around 3.5 wins.
FanGraphs’ WAR model (fWAR), though, is based on Fielding Independent Pitching (FIP), making it more forward looking than its cousins. In terms of fWAR, Estrada was worth only 1.8 wins. Estrada posted a subpar 4.40 FIP (107 FIP-), thanks to a paltry 18.1% strikeout rate, and this would have been higher if not for a seemingly unsustainable 8.7% home run per fly ball rate (which explains why Estrada posted a career-low 4.93 xFIP).
Only 25 pitchers in the last 50 years have had a bigger gap between their ERAs and FIPs in a single season, and Estrada’s insane .216 batted average on balls in play (BABIP) is the driving force here.
If you think Estrada will post a BABIP this low again, you should probably talk about it with the Nigerian prince you’ve been wiring money to.
Then again, he (Estrada, not the Nigerian prince) has a history of running low BABIPs, thanks to his profile as a high-fly ball, high-soft contact rate pitcher.
So will Estrada post an ERA on the low threes in 2016, or one in the high fours like his xFIP implies? The answer is almost certainly somewhere in the middle, as there are a number of underlying factors to consider (apologies if you were looking for a #HotTake like “Marco Estrada single-handedly disproves DIPS. Get off my lawn!" or "Marco Estrada should be designated for assignment immediately because he is only lucky and has no talent!").
Reasons for Skepticism
While there is a good case to be made Estrada has a degree of control over his batted balls, this does not mean we should ignore his peripherals.
This is problematic, given xFIP and K-BB% rates that have been declining for three years. A steady drop in strikeout rate is the main culprit. After fanning a quarter of the batters he faced in 2012, his K-rate plummeted to 18.1% (the drop is evident on a per inning basis as well).
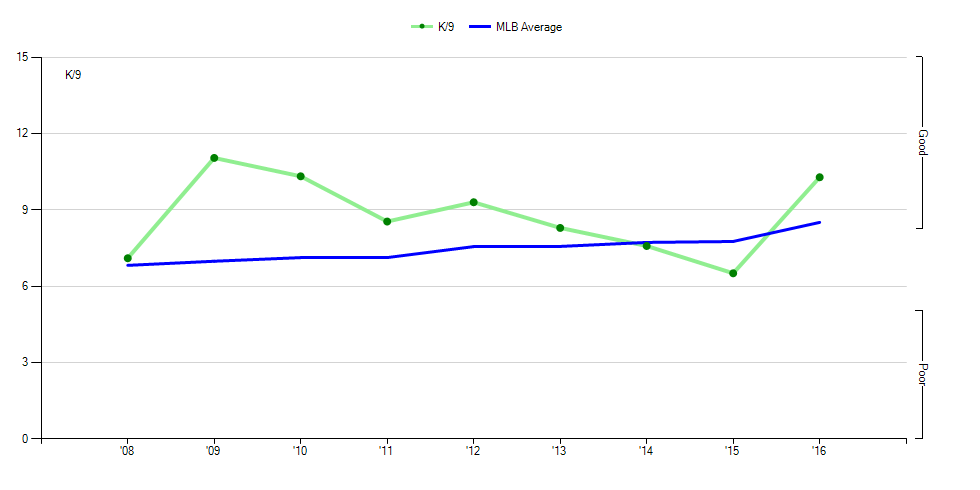
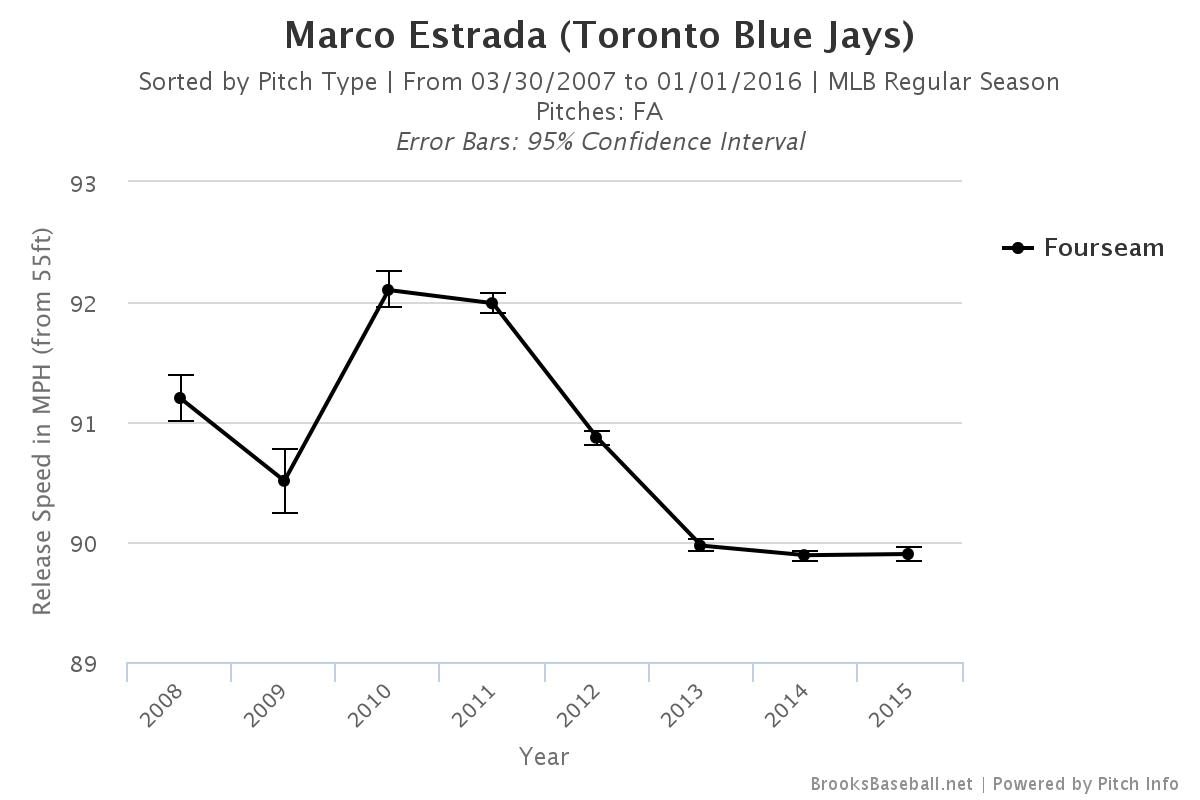
All the indicators you would expect in a decline in strikeouts are evident, such as a drop in fastball velocity and whiff-per-swing rate, as you can see in the charts below, courtesy of Brooks Baseball.
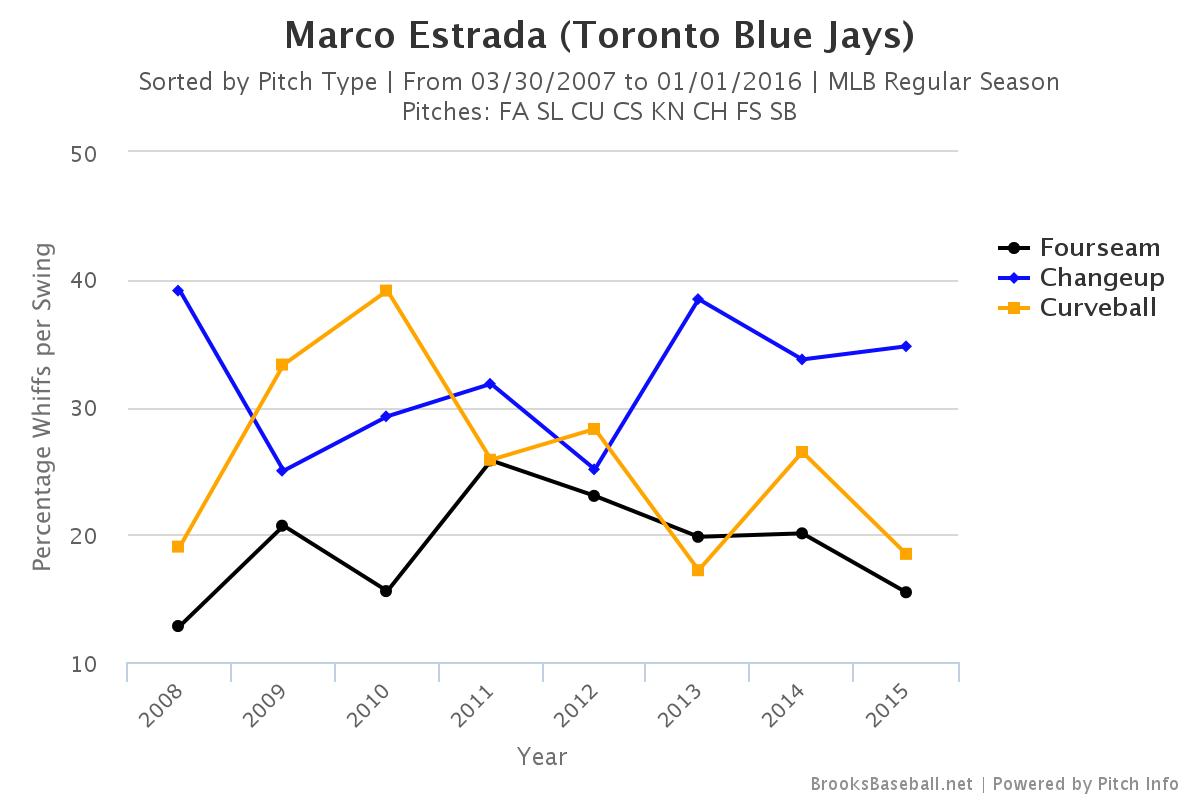
It should be noted that Estrada’s whiff-per-swing and whiff-per-pitch rates were roughly league average in 2015, so perhaps we should expect some positive regression in 2016 in the strikeout department.
Still, given his 7.6% walk rate that was also around league average last year and a 32.2% ground ball rate that was third-lowest in the big leagues, Estrada will need to suppress both his BABIP and home run per fly ball rates to be above-average in terms of run prevention.
In 2015, he was aces in both departments, as in addition to his aforementioned .216 BABIP, he ran an 8.7% HR/FB rate, well below the AL average of 11.3%.
It might be tempting to chalk this up to his batted ball profile, rather than random variation, as there is research indicating fly ball pitchers allow fewer home runs per fly ball than ground ball pitchers.
However, if this is truly a skill Estrada possesses, it had not manifested itself until 2015, as his career HR/FB% is 11.0%, and he has been in double-digits in each of his full big league seasons (he allowed a rate of 9.1% in seven innings in 2009).
His infield fly per fly ball rate in 2015 was 11.6%, according to FanGraphs, and while this was above the AL average of 10.1%, it probably does not explain the low home run rate.
Also, it should be noted that even with his low HR/FB rate, he allowed 1.19 home runs per nine innings, which is worse than the league average of 1.06. Had he allowed 11.0% of his fly balls to leave the park, his HR/9 would been an ungodly 1.49 (essentially what @dan haren allowed last year; only three pitchers were worse, and this explains Estrada’s low xFIP).
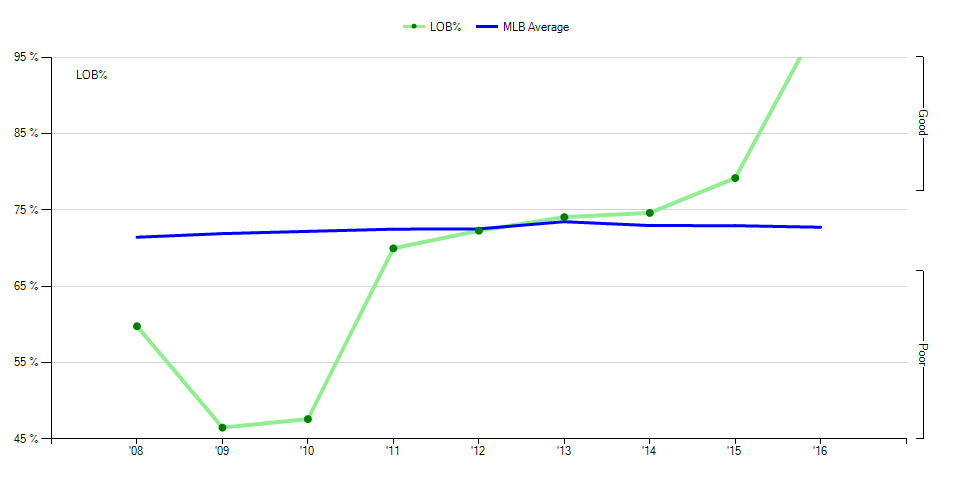
Estrada was also the beneficiary of a 79.2% strand rate, another stat which is prone to random variation and is a sign of good or bad fortune. Some pitchers do seem to have more control over strand rate than others, but Estrada does not seem to be one of them, as he has been between 70% and 74.6% since his first full big league season in 2011.
Even if Estrada does have control over his balls in play, something we’ll get to shortly, we should expect a good deal of regression in other areas that helped suppress his ERA last year.
Reasons For Optimism
Let's get something out of the way quickly: Marco Estrada is not posting a .216 BABIP again.
Regardless of how strongly you feel about Defense-Independent Pitching Stats being overrated, or contact management being a true skill, this isn't happening again.
Estrada is one of 20 pitchers since 1900 who qualified for the ERA title and allowed a BABIP of.216 or lower in the same season, and the previous 19 all saw their BABIP worsen in the following season.
| Season | Name | Team | BABIP | Next Year BABIP | Difference |
|---|---|---|---|---|---|
| 1906 | Ed Reulbach | Cubs | 0.196 | 0.247 | -0.051 |
| 1968 | Dave McNally | Orioles | 0.201 | 0.258 | -0.057 |
| 1949 | Tommy Byrne | Yankees | 0.205 | 0.261 | -0.056 |
| 1907 | Carl Lundgren | Cubs | 0.206 | 0.29 | -0.084 |
| 1972 | Catfish Hunter | Athletics | 0.207 | 0.227 | -0.02 |
| 1988 | Jeff Robinson | Tigers | 0.208 | 0.264 | -0.056 |
| 1956 | Don Larsen | Yankees | 0.213 | 0.238 | -0.025 |
| 1965 | Eddie Fisher | White Sox | 0.214 | 0.243 | -0.029 |
| 1964 | Wally Bunker | Orioles | 0.214 | 0.25 | -0.036 |
| 1947 | Spec Shea | Yankees | 0.214 | 0.217 | -0.003 |
| 1967 | Joe Horlen | White Sox | 0.214 | 0.249 | -0.035 |
| 1959 | Art Ditmar | Yankees | 0.216 | 0.251 | -0.035 |
| 1968 | Luis Tiant | Indians | 0.216 | 0.252 | -0.036 |
| 1918 | Allen Sothoron | Browns | 0.216 | 0.271 | -0.055 |
| 1964 | Joe Horlen | White Sox | 0.216 | 0.264 | -0.048 |
| 1952 | Warren Hacker | Cubs | 0.216 | 0.251 | -0.035 |
| 1970 | Wayne Simpson | Reds | 0.216 | 0.257 | -0.041 |
| 1961 | Milt Pappas | Orioles | 0.216 | 0.266 | -0.05 |
| 2015 | Marco Estrada | Blue Jays | 0.216 | --- | |
| Median | 0.214 | 0.2515 | -0.0385 |
The group saw an average decline of almost 40 points, and only four were even below .240 in the following year. You might notice Spec Shea came the closest to duplicating the feet, as he only ran a .217 BABIP in 1948. Over the next two years, though, he allowed BABIPs of .245 and .308, and finished with a career mark of .250.
You might also see that Estrada is the only pitcher listed after 1988, which makes sense given BABIPs have risen in recent decades. After living in the .290s and low .300s until World War II, the average BABIP generally hovered in the area of .280. From 1977 to 1992, the average was in the mid- to high-.280s, before jumping to .294 in 1993; it has never been below .293 since, and since 2008, the range has been between .300 and .297.
This makes Estrada even more of an outlier than his low BABIP peers.
Still, it might be prudent not to regress Estrada’s BABIP all the way to .300 when projecting his 2016 season. He has always profiled as a high fly ball rate pitcher, and fly ball pitchers tend to run lower BABIPs than ground ball ones (fly balls produce outs more often than grounders, though they also go for extra base hits more frequently).
For his career, Estrada has run a .261 BABIP on 2,077 balls in play. Russell Carleton of Baseball Prospectus found that BABIP needs roughly 2,000 balls in play to hit its stabilization point; this is essentially the sample size large enough to say a stat has as much to do with performance than random variation.
With this in mind, we can say that Estrada has had at least some degree of control over his low BABIPs, and this makes sense in light of the high frequency of soft contact he allows, as well as the low line drive rates.
From 2013 to 2015, Estrada's 17.0% line drive rate is the lowest in baseball, his 11.9% infield fly rate is tied for 10th, and his 20.2% soft-contact rate is tied for 11th, according to FanGraphs.
His projected ball in play rates for this season reflect this, as rather than forecasting him to be league average, Steamer and ZiPS project BABIPs of .270 and .273, respectively.
Those numbers makes intuitive sense, and while we should expect regression across the board, it seems that we can also expect another season of average or even above average run prevention from Estrada.


